Micro-channel heat sink: the model reads 0.95 to 2.09 °C hot at all four thermocouples
I modelled one water micro-channel and the copper around it, heated from below, and compared the copper temperature at four thermocouples with Qu and Mudawar's measurements. On the finest of four grids the model is hotter at every station. Only one thermocouple has a numerical band, and the measured values are read from a figure.
- TC1 temperature, simulation
- 41.08 °C
- finest of four grids, 268,522 cells
- TC1 temperature, experiment
- 40.13 °C
- Qu and Mudawar 2002, digitised from Fig. 7 (±0.5 °C)
- Signed difference, TC1
- +0.95 °C
- simulation minus experiment; TC2 to TC4: +2.09 °C, +1.87 °C, +1.42 °C
- Numerical uncertainty
- about 0.5 K at TC1
- 95 % least-squares band, this scheme only; none at TC2, TC3, TC4
2Geometry, mesh, results
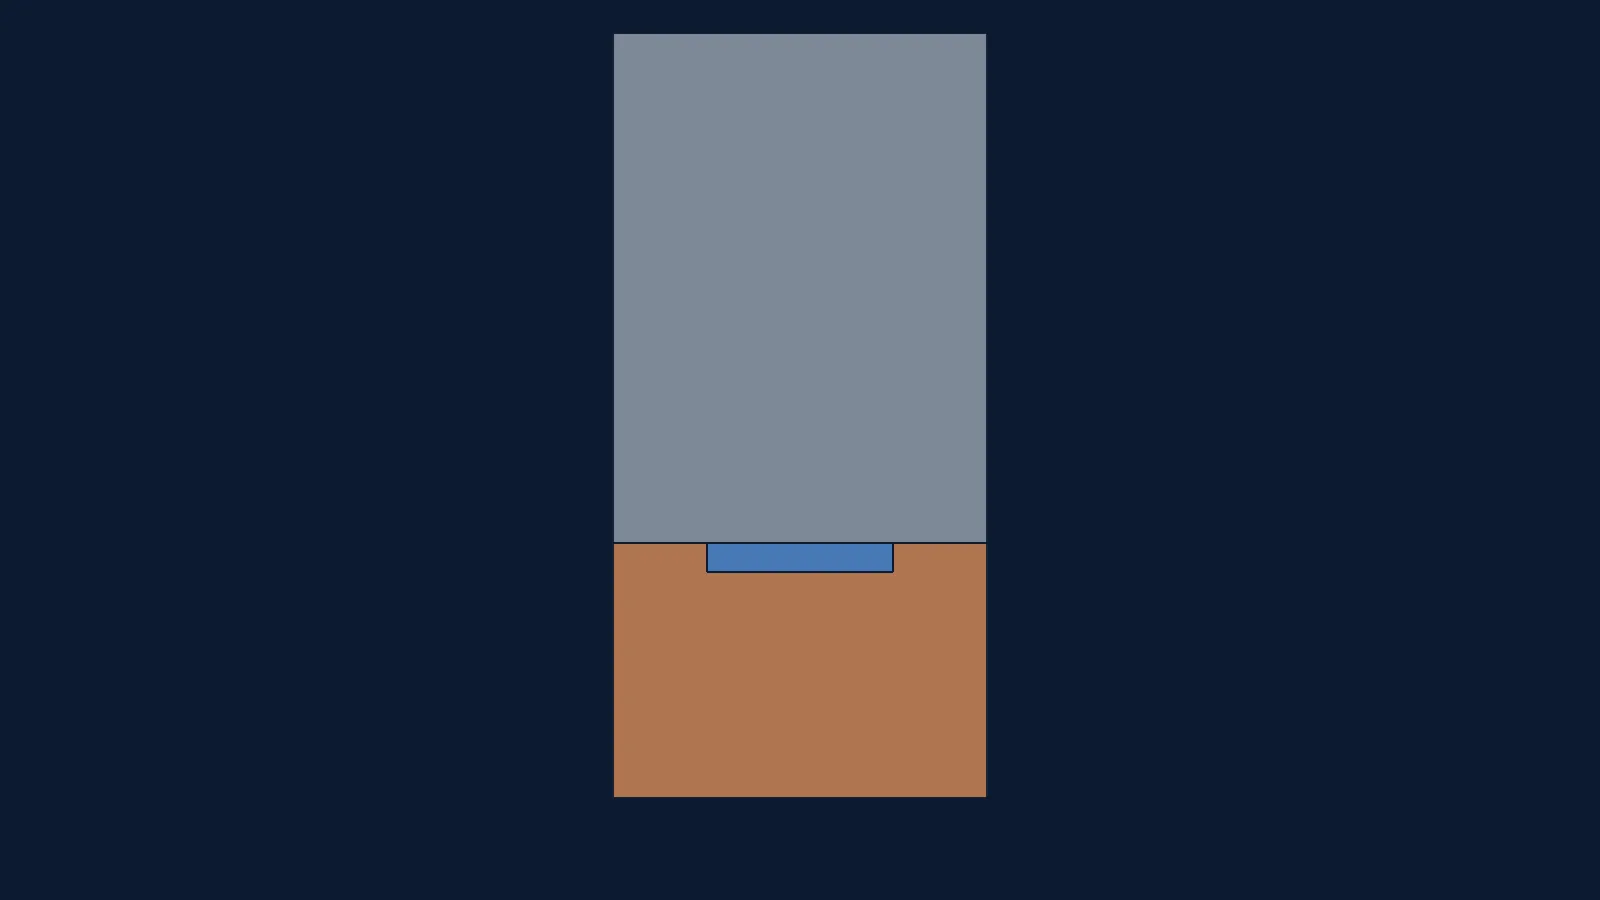
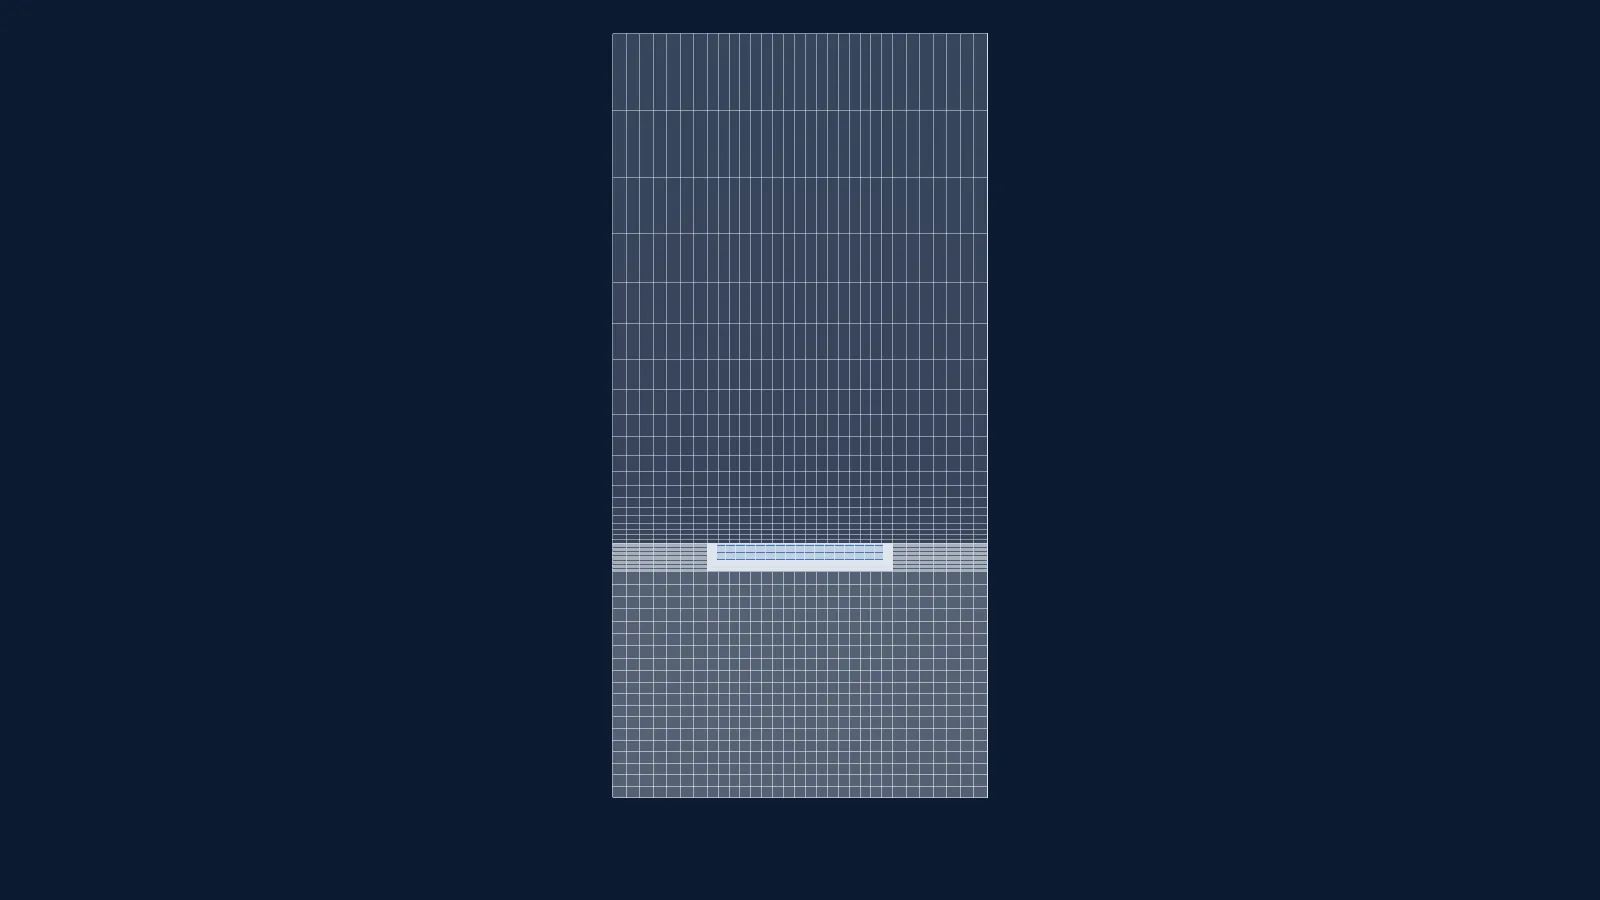
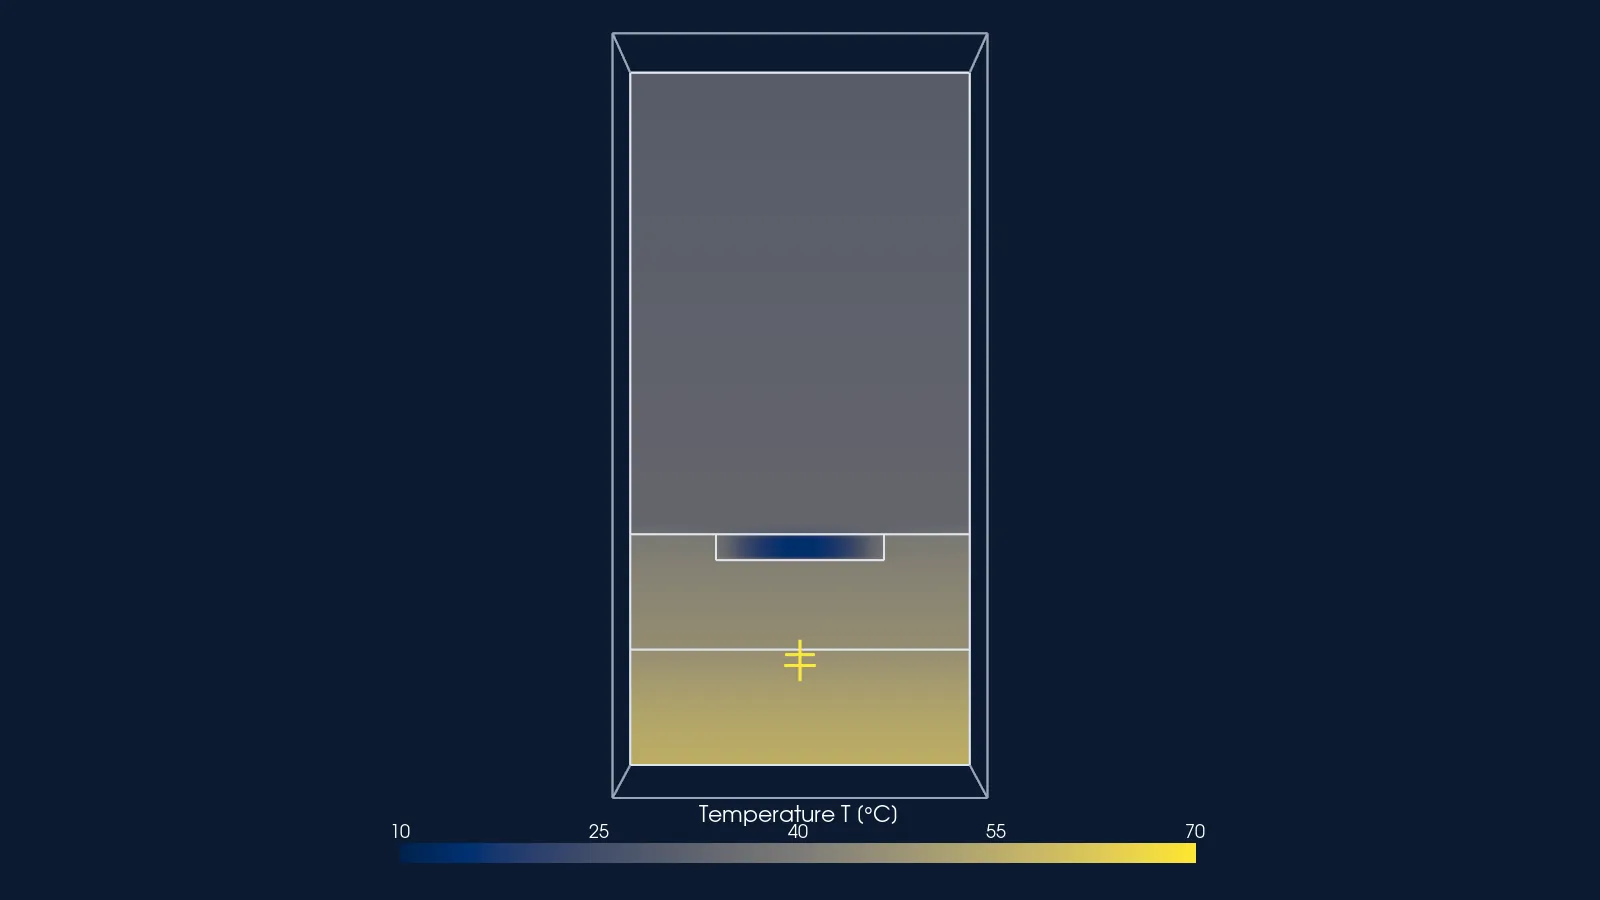
One micro-channel unit cell of the Qu & Mudawar heat sink: copper block heated from below, water channel, polycarbonate cover and three air slots; symmetry planes at both sides. Width (y) drawn 20 times true scale.
Not to scale: y drawn 20 times true scale. Probe positions are given in true coordinates.
No poster exported for this step.
Drag to rotate, right-drag or two fingers to pan, wheel or pinch to zoom, click to read a value. Keys: arrows pan, W A S D rotate, + and − zoom, Enter reads the value at the centre.
3Case parameters
| Reynolds number (inlet properties, hydraulic diameter) | 890 |
|---|---|
| Effective heat flux (planform) | 100 W/cm², 21.3333 W per channel |
| Inlet velocity | 2.904014677 m/s |
| Inlet water temperature | 288.15 K (15 °C) |
| Hydraulic diameter | 348.947 µm |
| Solver | OpenFOAM v2412, chtMultiRegionSimpleFoam, steady |
| Turbulence model | None: laminar |
| Cells | 11,660 to 268,522 (four grids) |
| Heat flux applied on the copper base | 1,143,070 W/m² (114.3 W/cm²); 448 W over the whole sink |
| Channel | 231 µm wide, 713 µm deep, 44.764 mm long; unit-cell width 467 µm |
| Fluid | Water, density 999.1011 kg/m³, inlet viscosity 0.001137569 Pa s; temperature-dependent viscosity, conductivity and heat capacity (my fits to IAPWS-97) |
| Solids | Copper 401 W/m K; polycarbonate cover 0.2 W/m K; three air pockets 0.026 W/m K (treated as stagnant solid) |
| Wall treatment | Not applicable (laminar, resolved conjugate interfaces) |
| Run cost | 15,000 iterations on the finest grid, one core; wall time not recorded |
4Experiment
Qu and Mudawar (2002) tested a copper heat sink with 21 parallel micro-channels, 231 µm wide and 713 µm deep, cooled by water and heated from below. Four thermocouples sit in the copper at x = 5, 16.588, 28.176 and 39.764 mm from the inlet, 3.175 mm above the base. I use one operating point: 100 W/cm² effective heat flux at Reynolds number 890, where the measured temperatures are 40.13 °C, 45.09 °C, 50.34 °C and 55.30 °C.
The thermocouple temperatures are not tabulated in the paper; they exist only as markers in its Fig. 7. I digitised them from the figure (marker detection on the embedded raster) and estimate the digitising uncertainty at ±0.5 °C. The paper's own figure is not reproduced here, for copyright.
Only this one operating point has a grid ladder. The paper reports five more points, which I ran on one mesh only; they are not shown.
| Stated uncertainty | Two separate terms, not combined: thermocouple uncertainty less than 0.3 °C (the paper, Sec. 2.4) and my digitising estimate ±0.5 °C. The paper also states wattmeter below 0.5 %, rotameters below 4 %, pressure transducers below 3.5 %, heat loss to ambient below 1 %; the rotameter term enters the Reynolds number, and I did not propagate it. |
|---|---|
| Blockage and corrections | Not applicable: an internal flow in a closed test module, no tunnel blockage. |
| Licence | Licence not stated locally; the paper is copyright Elsevier (Int. J. Heat Mass Transfer, 2002). The four values are digitised by me from Fig. 7 and attributed to Qu and Mudawar (2002); the figure itself is not reproduced. |
Thermocouple temperatures, q 100 W/cm², Re 890 (digitised from Qu and Mudawar 2002, Fig. 7)
Experimental values (4 points)
| Distance from the channel inlet x (m) | Measured, digitised (bar: digitising estimate) | Measured, same points (bar: thermocouple uncertainty, paper) | Measured, digitised (bar: digitising estimate), uncertainty | Measured, same points (bar: thermocouple uncertainty, paper), uncertainty |
|---|---|---|---|---|
| 0.005 | 40.13 | 40.13 | 0.5 | 0.3 |
| 0.016588 | 45.09 | 45.09 | 0.5 | 0.3 |
| 0.028176 | 50.34 | 50.34 | 0.5 | 0.3 |
| 0.039764 | 55.3 | 55.3 | 0.5 | 0.3 |
5Set-up
One unit cell of the sink: a half copper wall either side of one channel, the channel, the polycarbonate cover above and the copper block below, 467 µm wide, 19.05 mm tall and 44.764 mm long. The side faces are symmetry (adiabatic) planes, so the cell stands for a channel in the middle of the sink. Six regions are solved together: water, copper, cover and three air pockets.
The paper's unit-cell width does not match its channel count: 467 µm against 476 µm (10 mm over 21 channels). I kept the stated power per channel, so the heat flux over the cell's footprint is 102.05 W/cm² instead of 100. The air pockets in the copper (1.6 mm wide and 3.175 mm tall at x = 10.79, 22.38 and 33.97 mm) are read from the paper's drawings; the text gives no dimensions.
The heat flux is applied on the copper part of the base only, with the pocket bottoms adiabatic, so the power per channel is conserved. The thermocouple temperature is the copper temperature at the probe position, linearly interpolated from cell centres; there is no model of the thermocouple hole or bead.
| Boundary | Type | Value |
|---|---|---|
| Channel inlet | fixed velocity; fixed temperature; fixed-flux pressure | 2.904014677 m/s; 288.15 K (15 °C) |
| Channel outlet | fixed pressure; inletOutlet for U and T | p_rgh 101325 Pa |
| Channel walls (to copper, to cover) | no-slip; coupled temperature (turbulentTemperatureCoupledBaffleMixed) | |
| Copper base (bottomCu) | fixed heat flux (externalWallHeatFluxTemperature, flux mode) | 1,143,070 W/m² |
| Cover top | convection to ambient (externalWallHeatFluxTemperature, coefficient mode) | h 10 W/m²K to 298.15 K |
| Side planes, solid ends, pocket bottoms | zero gradient (adiabatic) | |
| Solid-solid interfaces (copper, cover, pockets) | coupled temperature |
Numerics and convergence
Steady chtMultiRegionSimpleFoam, laminar, gravity off. Convection: bounded linearUpwind for momentum and energy, with an unlimited linear gradient; the same frozen settings on all four grids.
Convergence was judged on the thermocouple temperatures themselves, not on residuals or the outlet temperature: each grid ran until the largest thermocouple change was below 0.002 K per 500 iterations twice in a row. The finest grid stopped at iteration 15,000, with a last change of 0.0014 K. The outlet water temperature on the finest grid is 298.819 K.
With the linearUpwind energy scheme the water temperature falls up to 2.25 K below the inlet value near the inlet. This does not shrink with refinement (1.9-2.3 K on all four grids), so that part of the solution is not in the asymptotic range. Its effect on the copper thermocouple temperatures has not been isolated and is not inside the numerical band.
6Mesh
| Cells, finest grid | 268,522: water 53,108, copper 121,236, cover 88,040, each air pocket 2,046 |
|---|---|
| Mesh type | Orthogonal block-structured hexahedra, split into six regions |
| y+ | Not applicable: laminar flow, no wall function |
| Max non-orthogonality | 0 |
| Max skewness | 2.1e-13 |
| Max aspect ratio | 50.6 (water), 142.4 (cover) |
| checkMesh, standard (all six regions) | “Mesh OK.” in each region, on all four grids |
| checkMesh, extended | “Failed 1 mesh checks.” in the copper, cover and pockets: small cell determinant (10,938 copper cells, 39,394 cover cells); the water region passes |
| Grid | Cells (water) | Iterations | TC1 (K) | TC2 (K) | TC3 (K) | TC4 (K) |
|---|---|---|---|---|---|---|
| f0.5 (not geometrically similar) | 11,660 (2,544) | 3,000 | 315.43950 | 320.25480 | 324.76932 | 329.03140 |
| f0.7 | 36,208 (6,424) | 5,000 | 314.79046 | 320.17851 | 324.89655 | 329.27648 |
| f1 | 96,800 (19,200) | 22,000 | 314.41539 | 320.25028 | 325.18739 | 329.66710 |
| f1.4 (finest) | 268,522 (53,108) | 15,000 | 314.23305 | 320.33383 | 325.35640 | 329.87345 |
Every grid passes the standard checkMesh in all six regions. The extended check fails one test, small cell determinant, in the solid regions; the cells are long and flat (aspect ratio up to 142.4 in the cover), not skewed or non-orthogonal.
The coarsest grid (11,660 cells) is not a geometric refinement of the three finer grids. At TC1 it falls on the same convergence curve; at TC3 and TC4 it does not, which is why no band is given there. A fifth, similar grid (about 0.78 M cells) was not run.
7Results
At the finest of four grids (268,522 cells) the steady laminar conjugate model reads +0.95, +2.09, +1.87 and +1.42 C above the four thermocouples (digitised from Fig 7 of Qu and Mudawar 2002, +-0.5 C digitising estimate) at Re 890, 100 W/cm² planform heat flux. This is a comparison; it is not a validation.
Data table (4 rows)
| Distance from the channel inlet x (m) | Measured, digitised (bar: digitising estimate) | Measured, same points (bar: thermocouple uncertainty, paper) | Simulation, finest of four grids |
|---|---|---|---|
| 0.005 | 40.13 | 40.13 | 41.08305 |
| 0.016588 | 45.09 | 45.09 | 47.18383 |
| 0.028176 | 50.34 | 50.34 | 52.2064 |
| 0.039764 | 55.3 | 55.3 | 56.72345 |
Data table (4 rows)
| Cells, thousands (four grids) | TC1 | TC2 | TC3 | TC4 |
|---|---|---|---|---|
| 11.66 | 2.1595 | 2.0148 | 1.27932 | 0.5814 |
| 36.208 | 1.51046 | 1.93851 | 1.40655 | 0.82648 |
| 96.8 | 1.13539 | 2.01028 | 1.69739 | 1.2171 |
| 268.522 | 0.95305 | 2.09383 | 1.8664 | 1.42345 |
| Quantity | Experiment | Simulation, finest grid | Signed difference (°C) |
|---|---|---|---|
| TC1, x 5 mm | 40.13 °C | 41.08 °C | +0.95 °C |
| TC2, x 16.588 mm | 45.09 °C | 47.18 °C | +2.09 °C |
| TC3, x 28.176 mm | 50.34 °C | 52.21 °C | +1.87 °C |
| TC4, x 39.764 mm | 55.30 °C | 56.72 °C | +1.42 °C |
The model is hotter everywhere, by more than the digitising estimate at every station: TC1 by about twice it, TC2 to TC4 by three to four times. The outlet water temperature is the same on all four grids to within 0.002 K and closes the energy balance to +0.13 % (21.36 W absorbed against 21.33 W input). So the water takes the right heat; the excess is in the temperature between the water and the thermocouples.
Gap and band side by side, at TC1: the model is +0.95 °C above the measurement, and the numerical uncertainty there is about 0.5 K for this scheme. At TC2, TC3 and TC4 there is no numerical band. This is a comparison, not a validation.
The paper's own unit-cell model, read from the curves in its Fig. 7, also lies above its measurements at this point. I read those curves from the raster with about 1 K error, so I use this only as a remark: the overshoot is not obviously specific to my set-up.
8Numerical accuracy
Four grids, one frozen set of numerical settings, least-squares grid-convergence estimates (Eça and Hoekstra 2014) through the shared GCI tool, with the cell size taken from the total cell count. A separate verification review set the wording below; where it refused a band, none is given.
At TC1 the four-grid least-squares estimate (Eca and Hoekstra 2014; observed order 1.5) gives a 95 % numerical uncertainty of about 0.5 K for the linearUpwind discretisation (grid term 0.24-0.58 K depending on whether cell size is taken from the fluid, whole-domain or copper cell count, plus 0.03 K iterative). The band covers grid and iteration error of this scheme only; it does not cover the choice of convection scheme or the below-inlet temperature undershoot described below.
At TC2 the four grids show no grid convergence (all four values lie within 0.155 K of each other); no numerical uncertainty is claimed.
At TC3 and TC4 no numerical uncertainty is claimed: the temperature rises steadily with refinement, but the coarsest grid is not a geometric refinement of the other three. With it, the sequence shows no convergent order, and the three similar grids alone are too few for the least-squares method.
The outlet water temperature is the same on all four grids to within 0.002 K and closes the energy balance to +0.13 % (21.36 W absorbed against 21.33 W input).
The coarsest grid (11,660 cells) is not a geometric refinement of the three finer grids. At TC1 it falls on the same convergence curve; at TC3 and TC4 it does not, which is why no band is given there. A fifth, similar grid (about 0.78 M cells) was not run.
With the linearUpwind energy scheme the water temperature falls up to 2.25 K below the inlet value near the inlet. This does not shrink with refinement (1.9-2.3 K on all four grids), so that part of the solution is not in the asymptotic range. Its effect on the copper thermocouple temperatures has not been isolated and is not inside the numerical band.
A first-order upwind run on the 96,800-cell grid gave thermocouple temperatures 0.3-1.9 C lower (largest at TC1; both runs indicative, not iteration-converged at the thermocouples). This scheme sensitivity exceeds the TC1 numerical band and is a separate, unquantified term.
Output of the shared GCI tool, unedited
TC1, cell size from the total cell count
LSR      Eca & Hoekstra 2014 least-squares, ng=4  (h sorted finest->coarsest: 1.0000, 1.4051, 1.9501, 2.8451)
         f: 314.233050, 314.415390, 314.790460, 315.439500
         delta_RE unweighted p =   1.5031   sigma = 0.02766
         delta_RE eq16       p =   1.5496   sigma = 0.02796
         observed order p = 1.503   (formal 2.0)   verdict: apparently monotonic
         chosen fit: p-free (unweighted)   phi0 = 313.903869   alpha = 0.319569
         sigma = 0.02766   Delta_phi = 0.4022   F_sigma = 0.069  (want < 1)
         U_phi(finest) = 0.436735  (0.139 % of f_fine; eq (20); Fs=1.25; eps=0.3196, sigma=0.02766, |f-fit|=0.009612)
TC1, cell size from the water cell count
LSR      Eca & Hoekstra 2014 least-squares, ng=4  (h sorted finest->coarsest: 1.0000, 1.4037, 2.0220, 2.7535)
         f: 314.233050, 314.415390, 314.790460, 315.439500
         delta_RE unweighted p =   2.0470   sigma = 0.007691
         delta_RE eq16       p =   2.0303   sigma = 0.007821
         observed order p = 2.047   (formal 2.0)   verdict: apparently monotonic
         chosen fit: p=2 (eq16)   phi0 = 314.051077   alpha = 0.182668
         sigma = 0.005989   Delta_phi = 0.4022   F_sigma = 0.015  (want < 1)
         U_phi(finest) = 0.235019  (0.075 % of f_fine; eq (20); Fs=1.25; eps=0.1827, sigma=0.005989, |f-fit|=0.0006947)
         WARNING: delta_RE NOT used: p=2.047 > 2: 4 fixed-exponent fits (App. A bullet 2). Chosen 'p=2' (eq16) on smallest sigma.
TC1, cell size from the copper cell count
LSR      Eca & Hoekstra 2014 least-squares, ng=4  (h sorted finest->coarsest: 1.0000, 1.3947, 1.9159, 2.8855)
         f: 314.233050, 314.415390, 314.790460, 315.439500
         delta_RE unweighted p =   1.2867   sigma = 0.03814
         delta_RE eq16       p =   1.3459   sigma = 0.03861
         observed order p = 1.287   (formal 2.0)   verdict: apparently monotonic
         chosen fit: p-free (unweighted)   phi0 = 313.799944   alpha = 0.420292
         sigma = 0.03814   Delta_phi = 0.4022   F_sigma = 0.095  (want < 1)
         U_phi(finest) = 0.576319  (0.183 % of f_fine; eq (20); Fs=1.25; eps=0.4203, sigma=0.03814, |f-fit|=0.01281)
TC2, verdict line only (no band claimed)
observed order p = n/a (formal 2.0) verdict: anomalous (p <= 0 in both delta_RE fits)
TC3, verdict line only (no band claimed)
observed order p = n/a (formal 2.0) verdict: anomalous (p <= 0 in both delta_RE fits)
TC4, verdict line only (no band claimed: coarsest grid not similar)
observed order p = 0.170 (formal 2.0) verdict: apparently monotonic
From data/cht-qu-mudawar/gci.json (tc1_total_h), data/cht-qu-mudawar/gci.json (tc1_fluid_h), data/cht-qu-mudawar/gci.json (tc1_copper_h), data/cht-qu-mudawar/gci.json (tc2_verdict), data/cht-qu-mudawar/gci.json (tc3_verdict), data/cht-qu-mudawar/gci.json (tc4_verdict), written by pipeline/build_assets.py.
9Why they differ, and what I distrust
Limits, as recorded in the ledger. A comparison, not a validation. The measured temperatures are digitised from a figure (+-0.5 C digitising estimate, kept separate from the paper's < 0.3 C thermocouple uncertainty) and only one operating point has a grid ladder. Only TC1 has a numerical band (about 0.5 K, 95 %, linearUpwind only); TC2 shows no grid convergence and TC3, TC4 and the outlet temperature get no band, because the coarsest grid is not a geometric refinement of the other three. The energy scheme undershoots the inlet temperature by up to 2.25 K on every grid, and a first-order run moved the thermocouples by 0.3-1.9 C, more than the TC1 band. Air-pocket geometry and the 467 um cell width are read from drawings; a unit cell has no plenum maldistribution. Paper copyright Elsevier; its figure is not reproduced.
- The measured values are digitised from a figure, not read from a table, and the digitising estimate is mine.
- Only one operating point has a grid ladder; the paper's other five points ran on one mesh here and are not shown.
- The energy scheme drives the water below its inlet temperature near the inlet, on every grid, and changing the scheme moves the thermocouples by more than the TC1 band. The band holds for this scheme only.
- Geometry read from drawings: the air pockets, the thermocouple height and the 467 µm cell width that disagrees with the channel count. Removing the pockets moved TC4 by −1.1 °C on an earlier, not thermocouple-converged run.
- A unit cell assumes all 21 channels carry the same flow and heat. The real module has inlet and outlet plenums, so flow can be maldistributed, and the heater block spreads heat in three dimensions. Both are possible causes of the excess and neither was tested.
- This compares a copper temperature, mostly set by conduction. No heat-transfer coefficient, Nusselt number or wall heat flux was compared.
10References
- W. Qu and I. Mudawar (2002), “Experimental and numerical study of pressure drop and heat transfer in a single-phase micro-channel heat sink”, International Journal of Heat and Mass Transfer 45, 2549-2565. DOI 10.1016/S0017-9310(01)00337-4. Fig. 7 thermocouple temperatures, digitised by me.
- L. Eça and M. Hoekstra (2014), “A procedure for the estimation of the numerical uncertainty of CFD calculations based on grid refinement studies”, Journal of Computational Physics 262, 104-130. DOI 10.1016/j.jcp.2014.01.006.
- IAPWS-97 liquid-water properties, as fitted by my water-property script (no further citation in the local files).
Source files
D:/CFD/data/heat-transfer/qu-mudawar-2002/fig7_tc_temperatures.csvD:/CFD/data/heat-transfer/qu-mudawar-2002/SOURCE.mdD:/CFD/cht-qu-mudawar/cases/qu_q100_re890_f{0.5,0.7,1,1.4}_LU/tc_history.csvD:/CFD/cht-qu-mudawar/cases/qu_q100_re890_f{0.5,0.7,1,1.4}_LU/SPEC.md, results_tc.txtD:/CFD/cht-qu-mudawar/cases/qu_q100_re890_f1.4_LU/log.checkMesh.standard, log.checkMeshD:/CFD/cht-qu-mudawar/cases/qu_q100_re890_f1.4_LU/log.chtMultiRegionSimpleFoam, converge_tc.logD:/CFD/cht-qu-mudawar/cases/qu_q100_re890_f1.4_LU/0/, constant/D:/CFD/cht-qu-mudawar/queue.logD:/CFD/cht-qu-mudawar/GCI-baseline-q100-re890.mdD:/CFD/cht-qu-mudawar/RESULTS-baseline-q100-re890.mdinvestigation/lane-E-cht-qu-mudawar.md and lane-E2-cht-verification-review.md (evidence audit and verification review)pipeline/case_data/cht-qu-mudawar.py (chart data and GCI tool output)
Last updated 2026-11-14. One-page summary (prints to one A4 page), also as a PDF. Every number on this page is checked against its source file by pipeline/check_numbers.py.