NACA 0012 at 10 degrees: lift extrapolated from three grids sits +2.14 % above a reference code and +3.4 to +3.8 % above experiment
Three O-grids give an extrapolated lift coefficient of 1.10083, with an observed order of about 1.2 and a GCI of 1.00 %. The finest grid fails one checkMesh test and its force history drifts more than my own convergence gate allows, so I list this case with caveats rather than lead with it.
- Lift coefficient, simulation
- 1.10083
- extrapolated from three grids
- Lift coefficient, reference code
- 1.07781
- CFL3D, NASA TMR (a computation)
- Signed difference
- +2.14 %
- simulation minus CFL3D
- Numerical uncertainty
- 1.00 %
- GCI, three grids; finest grid fails one checkMesh test
2Geometry, mesh, results
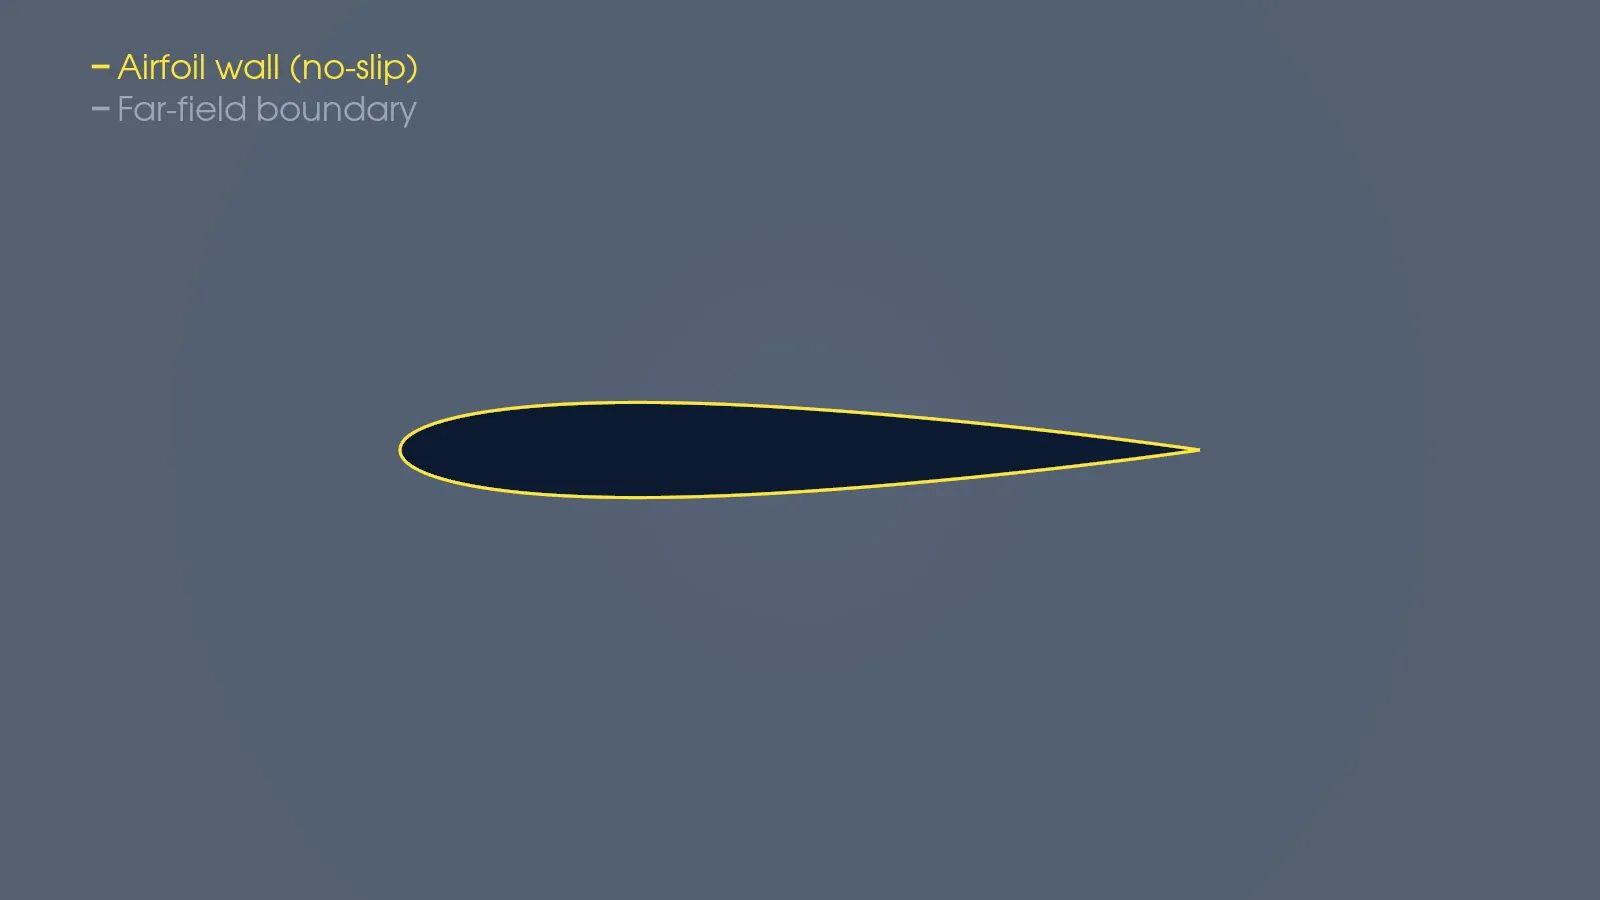
NACA 0012 section in a far-field domain about 2000 chords in radius; the airfoil wall and the far-field boundary drawn as lines.
No poster exported for this step.
Drag to pan, wheel or pinch to zoom, click to read a value. Keys: arrows pan, + and − zoom, Enter reads the value at the centre.
3Case parameters
| Reynolds number (chord) | 6 million |
|---|---|
| Angle of attack | 10° |
| Fluid | Incompressible, unit speed and chord |
| Solver | OpenFOAM simpleFoam, steady |
| Turbulence model | k-omega SST, fully turbulent |
| Wall y+ max | 1.65 coarse, 0.85 finest |
| Cells | 48,120 to 193,200 |
| Free-stream velocity | (0.984808 0.173648 0) |
| Kinematic viscosity | 1.66667e-07 m²/s |
| Pressure-velocity coupling | SIMPLEC (consistent), 2 non-orthogonal correctors |
| Wall y+ mean, coarse grid | 0.54 |
| Run cost | Not recorded |
4Experiment
Three references, all from the NASA Turbulence Modeling Resource files on disk. Lift: Ladson, NASA TM 4074 (1988), Re 6 million, transition tripped, Mach 0.15; interpolated to 10° it gives 1.0628. Surface pressure: Gregory and O'Reilly, NASA R&M 3726 (1970), at Re 2.88 million, digitised from a photocopy, approximate, upper surface only.
The reference computation is CFL3D with the SST model on a 897 × 257 grid. It is not an experiment: it is compressible at Mach 0.15 where I solve incompressible, and the reference codes on that page scatter by about a percent in lift themselves.
| Stated uncertainty | Not stated in the data files. The Gregory and O'Reilly file says its values were digitised from a photocopy and are only approximate. |
|---|---|
| Blockage and corrections | Not stated in the data files. The Gregory and O'Reilly Reynolds number (2.88 million) is half the simulation's, so its pressure curve is a shape check, not a match. |
| Licence | NASA Turbulence Modeling Resource data files (public NASA data), cited with the original reports named. The Gregory and O'Reilly table below is copied from that file with the sign of Cp flipped. |
Gregory and O'Reilly, upper-surface pressure at 10 degrees (x/c, −Cp)
Experimental values (24 points)
| x/c | Experiment, Gregory and O'Reilly (upper surface) |
|---|---|
| 0 | 3.66423 |
| 0.00218341 | 5.04375 |
| 0.00873362 | 5.24068 |
| 0.0131004 | 4.67125 |
| 0.0174672 | 4.32079 |
| 0.0480349 | 2.74347 |
| 0.0742358 | 2.26115 |
| 0.0982533 | 1.95405 |
| 0.124454 | 1.7345 |
| 0.146288 | 1.55884 |
| 0.176856 | 1.36109 |
| 0.28821 | 1.00829 |
| 0.320961 | 0.941877 |
| 0.384279 | 0.787206 |
| 0.447598 | 0.654432 |
| 0.515284 | 0.543461 |
| 0.576419 | 0.432633 |
| 0.637555 | 0.343703 |
| 0.700873 | 0.254725 |
| 0.766376 | 0.1657 |
| 0.831878 | 0.098572 |
| 0.893013 | 0.00964205 |
| 0.958515 | -0.0793835 |
| 1 | -0.124088 |
5Set-up
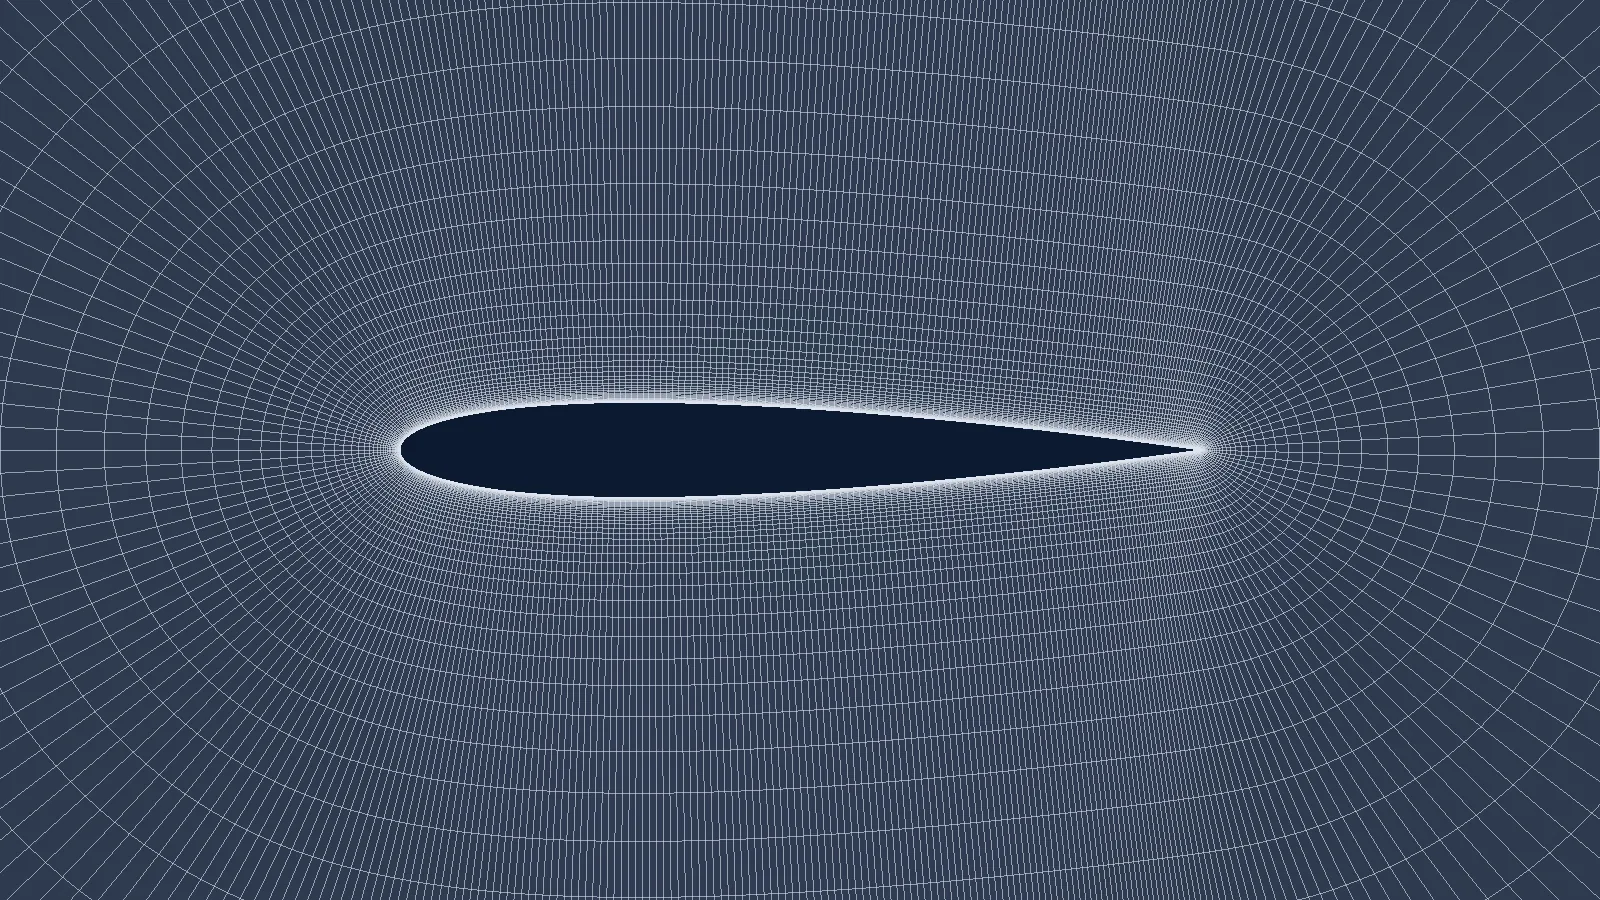
A 2-D O-grid around a NACA 0012 with a near-sharp trailing edge (base thickness 0.0003 c), far field at 2000 chords. The three grids share the geometry and only scale the cell counts; refinement ratios between neighbours are 1.334 and 1.502. The free-stream turbulence follows the NASA specification (turbulence intensity 0.052 %, nut/nu 0.009).
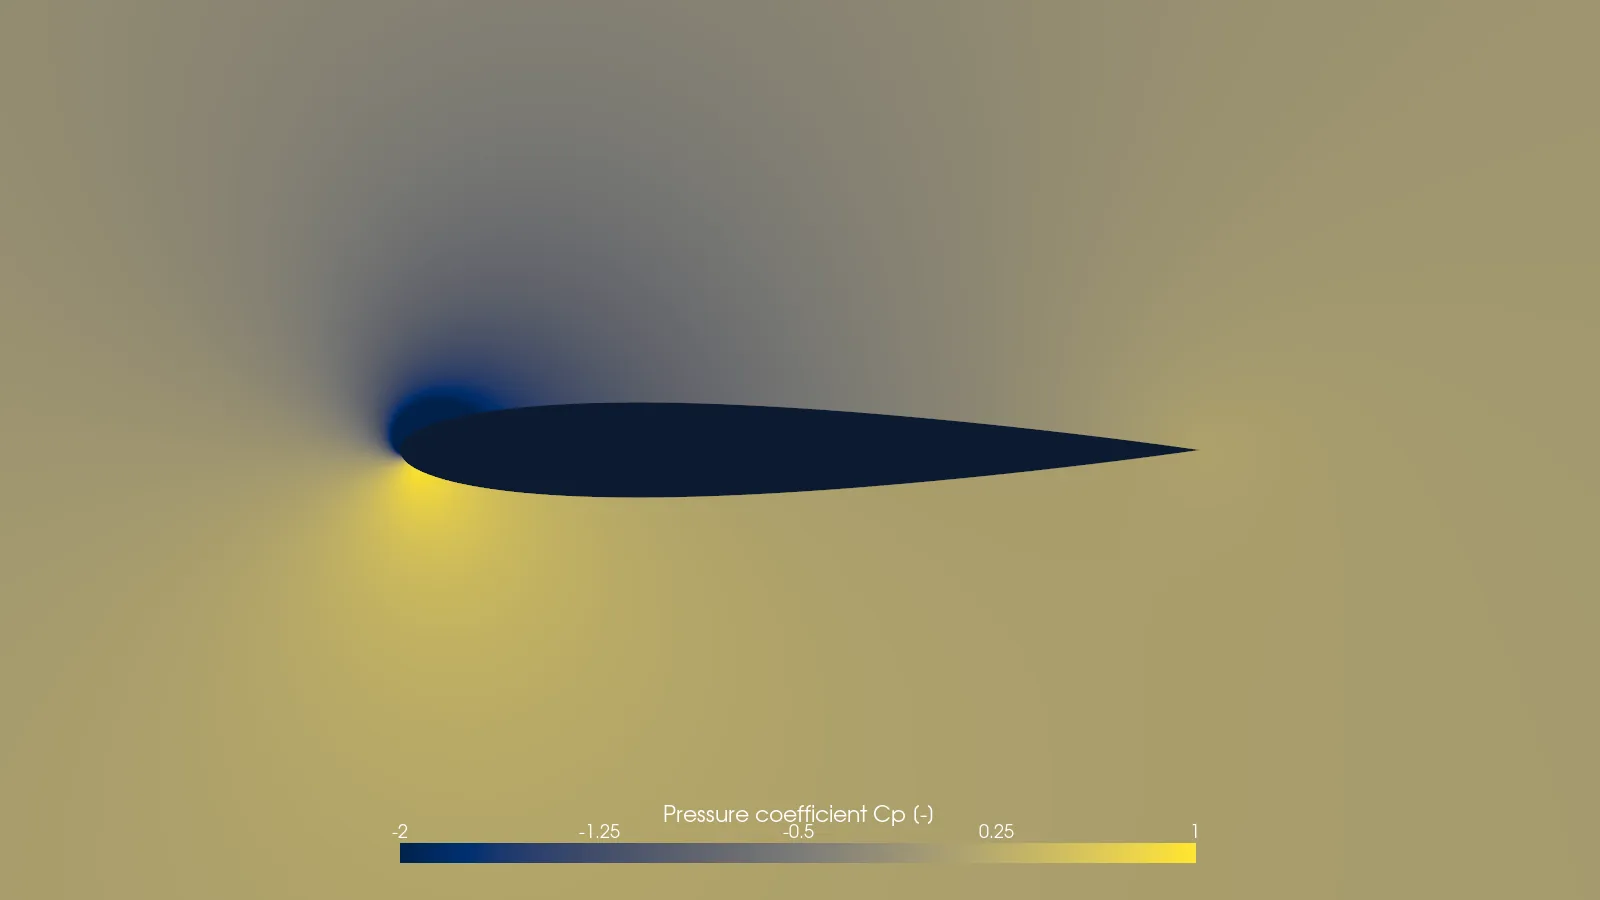
The pressure plots on this page come from a separate, longer run of the coarse grid recipe (48,120 cells, 20,000 iterations, final lift 1.0805); the grid ladder uses 6000 iterations per grid.
| Boundary | Type | Value |
|---|---|---|
| Far field (about 2000 chords) | freestreamVelocity; freestreamPressure; inletOutlet for k and omega; nut calculated | U (0.984808 0.173648 0); p 0; k 4.056e-07; omega 270.4 |
| Airfoil | noSlip; p zeroGradient; k kLowReWallFunction, 1e-10; omega omegaWallFunction, 270.4; nut nutLowReWallFunction | |
| Front, back | empty (2-D) |
Numerics and convergence
Steady simpleFoam, SIMPLEC (consistent), 2 non-orthogonal correctors. Convection: bounded Gauss linearUpwindV grad(U) for velocity, bounded Gauss limitedLinear 1 for k and omega.
Convergence is judged from the force history, not residuals: the gate is a tail-mean drift below 1e-5. The two finer grids miss it (drift 3.9e-5 and 1.8e-5, lane audit).
Data tables, one per series (401 points, 401 points)
| Iteration | Lift coefficient Cl |
|---|---|
| 1 | 4.86413549 |
| 51 | 0.985568223 |
| 101 | 1.253037 |
| 151 | 0.427887251 |
| 201 | 0.490638974 |
| 251 | 0.631878881 |
| 301 | 0.815152252 |
| 351 | 0.919065637 |
| 401 | 0.97069473 |
| 451 | 1.00616337 |
| 501 | 1.03390214 |
| 551 | 1.05467266 |
| 601 | 1.06877984 |
| 651 | 1.07661532 |
| 701 | 1.0795099 |
| 751 | 1.07984136 |
| 801 | 1.07974793 |
| 851 | 1.0798216 |
| 901 | 1.07987849 |
| 951 | 1.07991521 |
| 1001 | 1.08001176 |
| 1051 | 1.08006965 |
| 1101 | 1.08008992 |
| 1151 | 1.0800997 |
| 1201 | 1.08010267 |
| 1251 | 1.08010203 |
| 1301 | 1.08008594 |
| 1351 | 1.08007898 |
| 1401 | 1.0800798 |
| 1451 | 1.08007366 |
| 1501 | 1.08007311 |
| 1551 | 1.08006972 |
| 1601 | 1.08007047 |
| 1651 | 1.08007312 |
| 1701 | 1.08007152 |
| 1751 | 1.08006694 |
| 1801 | 1.08006367 |
| 1851 | 1.08006435 |
| 1901 | 1.08006709 |
| 1951 | 1.08013772 |
| 2001 | 1.08025488 |
| 2051 | 1.08030325 |
| 2101 | 1.08032081 |
| 2151 | 1.08031584 |
| 2201 | 1.0803113 |
| 2251 | 1.08030378 |
| 2301 | 1.08029811 |
| 2351 | 1.08028618 |
| 2401 | 1.08028922 |
| 2451 | 1.08028207 |
| 2501 | 1.08028005 |
| 2551 | 1.08028925 |
| 2601 | 1.08028709 |
| 2651 | 1.08028625 |
| 2701 | 1.08029539 |
| 2751 | 1.0802963 |
| 2801 | 1.0802948 |
| 2851 | 1.0802866 |
| 2901 | 1.08029066 |
| 2951 | 1.08028506 |
| 3001 | 1.0802845 |
| 3051 | 1.08028737 |
| 3101 | 1.08028818 |
| 3151 | 1.08028306 |
| 3201 | 1.08028079 |
| 3251 | 1.08028237 |
| 3301 | 1.08028754 |
| 3351 | 1.0802927 |
| 3401 | 1.08028371 |
| 3451 | 1.08028783 |
| 3501 | 1.08028716 |
| 3551 | 1.08028824 |
| 3601 | 1.0802781 |
| 3651 | 1.08028115 |
| 3701 | 1.08028307 |
| 3751 | 1.08027927 |
| 3801 | 1.08027852 |
| 3851 | 1.08027922 |
| 3901 | 1.08028688 |
| 3951 | 1.08028584 |
| 4001 | 1.08028173 |
| 4051 | 1.08028347 |
| 4101 | 1.08028666 |
| 4151 | 1.08028008 |
| 4201 | 1.08027921 |
| 4251 | 1.08028536 |
| 4301 | 1.08028591 |
| 4351 | 1.0802869 |
| 4401 | 1.08029149 |
| 4451 | 1.08029016 |
| 4501 | 1.08029776 |
| 4551 | 1.08029699 |
| 4601 | 1.08028837 |
| 4651 | 1.08028334 |
| 4701 | 1.08028711 |
| 4751 | 1.08028619 |
| 4801 | 1.08028244 |
| 4851 | 1.08028068 |
| 4901 | 1.08028471 |
| 4951 | 1.08028329 |
| 5001 | 1.0802841 |
| 5051 | 1.0802859 |
| 5101 | 1.08029004 |
| 5151 | 1.08028589 |
| 5201 | 1.08028795 |
| 5251 | 1.08029073 |
| 5301 | 1.08028526 |
| 5351 | 1.08028939 |
| 5401 | 1.08028717 |
| 5451 | 1.08028101 |
| 5501 | 1.08028078 |
| 5551 | 1.08028098 |
| 5601 | 1.08027642 |
| 5651 | 1.08027108 |
| 5701 | 1.08027293 |
| 5751 | 1.08028058 |
| 5801 | 1.08027967 |
| 5851 | 1.08027827 |
| 5901 | 1.08028311 |
| 5951 | 1.0802827 |
| 6001 | 1.08028029 |
| 6051 | 1.08027808 |
| 6101 | 1.08028656 |
| 6151 | 1.08028794 |
| 6201 | 1.08028634 |
| 6251 | 1.08029477 |
| 6301 | 1.08029031 |
| 6351 | 1.08028834 |
| 6401 | 1.08028588 |
| 6451 | 1.08028723 |
| 6501 | 1.08027739 |
| 6551 | 1.08028241 |
| 6601 | 1.0802823 |
| 6651 | 1.08027697 |
| 6701 | 1.08027979 |
| 6751 | 1.08027898 |
| 6801 | 1.08027776 |
| 6851 | 1.08027317 |
| 6901 | 1.0802764 |
| 6951 | 1.08028081 |
| 7001 | 1.08027583 |
| 7051 | 1.08027892 |
| 7101 | 1.08028363 |
| 7151 | 1.08028712 |
| 7201 | 1.08028366 |
| 7251 | 1.08028444 |
| 7301 | 1.08029257 |
| 7351 | 1.08029305 |
| 7401 | 1.08029277 |
| 7451 | 1.08029574 |
| 7501 | 1.08029871 |
| 7551 | 1.0802945 |
| 7601 | 1.08028561 |
| 7651 | 1.08028683 |
| 7701 | 1.08028874 |
| 7751 | 1.08028697 |
| 7801 | 1.08027801 |
| 7851 | 1.08028194 |
| 7901 | 1.08028436 |
| 7951 | 1.08028356 |
| 8001 | 1.08028068 |
| 8051 | 1.08028397 |
| 8101 | 1.0802844 |
| 8151 | 1.08028384 |
| 8201 | 1.08028058 |
| 8251 | 1.08028088 |
| 8301 | 1.0802859 |
| 8351 | 1.08028795 |
| 8401 | 1.08028686 |
| 8451 | 1.08029274 |
| 8501 | 1.08029445 |
| 8551 | 1.08029534 |
| 8601 | 1.08029873 |
| 8651 | 1.08028915 |
| 8701 | 1.08028861 |
| 8751 | 1.08028478 |
| 8801 | 1.08028141 |
| 8851 | 1.08028078 |
| 8901 | 1.08027915 |
| 8951 | 1.08028478 |
| 9001 | 1.08027994 |
| 9051 | 1.08028332 |
| 9101 | 1.08028417 |
| 9151 | 1.08029085 |
| 9201 | 1.08029051 |
| 9251 | 1.08028915 |
| 9301 | 1.08028591 |
| 9351 | 1.08029271 |
| 9401 | 1.08028659 |
| 9451 | 1.08028861 |
| 9501 | 1.08028502 |
| 9551 | 1.08029275 |
| 9601 | 1.08028682 |
| 9651 | 1.08028825 |
| 9701 | 1.08029035 |
| 9751 | 1.08029307 |
| 9801 | 1.0802867 |
| 9851 | 1.08028302 |
| 9901 | 1.08029039 |
| 9951 | 1.08028562 |
| 10001 | 1.08027887 |
| 10051 | 1.08028421 |
| 10101 | 1.08028032 |
| 10151 | 1.08028067 |
| 10201 | 1.08027351 |
| 10251 | 1.08027883 |
| 10301 | 1.0802772 |
| 10351 | 1.08027749 |
| 10401 | 1.08026918 |
| 10451 | 1.08027667 |
| 10501 | 1.08027703 |
| 10551 | 1.08027281 |
| 10601 | 1.08027101 |
| 10651 | 1.08028044 |
| 10701 | 1.08027929 |
| 10751 | 1.08027824 |
| 10801 | 1.08028795 |
| 10851 | 1.08028718 |
| 10901 | 1.08028217 |
| 10951 | 1.0802828 |
| 11001 | 1.08029112 |
| 11051 | 1.08028149 |
| 11101 | 1.08028354 |
| 11151 | 1.08028517 |
| 11201 | 1.08029285 |
| 11251 | 1.08028455 |
| 11301 | 1.08028525 |
| 11351 | 1.08028748 |
| 11401 | 1.08028081 |
| 11451 | 1.0802804 |
| 11501 | 1.08028485 |
| 11551 | 1.08027963 |
| 11601 | 1.08027125 |
| 11651 | 1.08028202 |
| 11701 | 1.08028419 |
| 11751 | 1.08027744 |
| 11801 | 1.08028342 |
| 11851 | 1.08028338 |
| 11901 | 1.08028344 |
| 11951 | 1.08027986 |
| 12001 | 1.08028363 |
| 12051 | 1.08028475 |
| 12101 | 1.0802789 |
| 12151 | 1.08028213 |
| 12201 | 1.08028447 |
| 12251 | 1.0802896 |
| 12301 | 1.08028413 |
| 12351 | 1.08028303 |
| 12401 | 1.08029509 |
| 12451 | 1.08028944 |
| 12501 | 1.08028867 |
| 12551 | 1.08028732 |
| 12601 | 1.08028795 |
| 12651 | 1.08029229 |
| 12701 | 1.08028656 |
| 12751 | 1.08029204 |
| 12801 | 1.08029445 |
| 12851 | 1.08029011 |
| 12901 | 1.08029064 |
| 12951 | 1.08028603 |
| 13001 | 1.08028451 |
| 13051 | 1.08027522 |
| 13101 | 1.08027075 |
| 13151 | 1.08027327 |
| 13201 | 1.08027412 |
| 13251 | 1.08027268 |
| 13301 | 1.0802792 |
| 13351 | 1.08028498 |
| 13401 | 1.08028477 |
| 13451 | 1.08028263 |
| 13501 | 1.08028853 |
| 13551 | 1.08028746 |
| 13601 | 1.08028352 |
| 13651 | 1.08028534 |
| 13701 | 1.08029014 |
| 13751 | 1.08028609 |
| 13801 | 1.08028233 |
| 13851 | 1.08029022 |
| 13901 | 1.080291 |
| 13951 | 1.08028811 |
| 14001 | 1.08029552 |
| 14051 | 1.08028797 |
| 14101 | 1.0802826 |
| 14151 | 1.08028806 |
| 14201 | 1.08028501 |
| 14251 | 1.08028338 |
| 14301 | 1.08027991 |
| 14351 | 1.08028295 |
| 14401 | 1.08028703 |
| 14451 | 1.08028188 |
| 14501 | 1.08028301 |
| 14551 | 1.0802861 |
| 14601 | 1.0802875 |
| 14651 | 1.0802864 |
| 14701 | 1.08029411 |
| 14751 | 1.08029397 |
| 14801 | 1.08028906 |
| 14851 | 1.08029272 |
| 14901 | 1.08029068 |
| 14951 | 1.08029017 |
| 15001 | 1.08028739 |
| 15051 | 1.08028605 |
| 15101 | 1.08028916 |
| 15151 | 1.08028922 |
| 15201 | 1.08028368 |
| 15251 | 1.08028457 |
| 15301 | 1.08028414 |
| 15351 | 1.08027845 |
| 15401 | 1.08027744 |
| 15451 | 1.08028362 |
| 15501 | 1.08028111 |
| 15551 | 1.08027966 |
| 15601 | 1.08027538 |
| 15651 | 1.08027522 |
| 15701 | 1.08028131 |
| 15751 | 1.08028268 |
| 15801 | 1.08027706 |
| 15851 | 1.08028214 |
| 15901 | 1.08029077 |
| 15951 | 1.08029603 |
| 16001 | 1.08029442 |
| 16051 | 1.08029651 |
| 16101 | 1.0802954 |
| 16151 | 1.08029536 |
| 16201 | 1.08028561 |
| 16251 | 1.08028594 |
| 16301 | 1.08028525 |
| 16351 | 1.08028131 |
| 16401 | 1.08033236 |
| 16451 | 1.08044403 |
| 16501 | 1.0805123 |
| 16551 | 1.08053844 |
| 16601 | 1.08053989 |
| 16651 | 1.08053479 |
| 16701 | 1.08052322 |
| 16751 | 1.08050878 |
| 16801 | 1.08049667 |
| 16851 | 1.08049299 |
| 16901 | 1.08049503 |
| 16951 | 1.08049424 |
| 17001 | 1.08049141 |
| 17051 | 1.08048527 |
| 17101 | 1.08048779 |
| 17151 | 1.08048615 |
| 17201 | 1.08048568 |
| 17251 | 1.08047777 |
| 17301 | 1.08047927 |
| 17351 | 1.0804854 |
| 17401 | 1.08048154 |
| 17451 | 1.08048295 |
| 17501 | 1.08047946 |
| 17551 | 1.08048859 |
| 17601 | 1.08048602 |
| 17651 | 1.08047851 |
| 17701 | 1.08048425 |
| 17751 | 1.08048479 |
| 17801 | 1.08048552 |
| 17851 | 1.08048108 |
| 17901 | 1.08048752 |
| 17951 | 1.08049196 |
| 18001 | 1.08048139 |
| 18051 | 1.08048275 |
| 18101 | 1.08048341 |
| 18151 | 1.08048983 |
| 18201 | 1.08048643 |
| 18251 | 1.08048164 |
| 18301 | 1.08047689 |
| 18351 | 1.08048505 |
| 18401 | 1.0804857 |
| 18451 | 1.08048343 |
| 18501 | 1.08048089 |
| 18551 | 1.08048681 |
| 18601 | 1.08048642 |
| 18651 | 1.08048295 |
| 18701 | 1.08048706 |
| 18751 | 1.08049014 |
| 18801 | 1.08048313 |
| 18851 | 1.08048607 |
| 18901 | 1.08049106 |
| 18951 | 1.08049179 |
| 19001 | 1.08048731 |
| 19051 | 1.0804825 |
| 19101 | 1.08048125 |
| 19151 | 1.08048105 |
| 19201 | 1.08048264 |
| 19251 | 1.08047874 |
| 19301 | 1.08048107 |
| 19351 | 1.0804826 |
| 19401 | 1.08049101 |
| 19451 | 1.08048329 |
| 19501 | 1.08048574 |
| 19551 | 1.08048172 |
| 19601 | 1.08048757 |
| 19651 | 1.08048486 |
| 19701 | 1.08048372 |
| 19751 | 1.08048577 |
| 19801 | 1.08048748 |
| 19851 | 1.08049072 |
| 19901 | 1.08048347 |
| 19951 | 1.0804915 |
| 20000 | 1.08049094 |
| Iteration | Drag coefficient Cd |
|---|---|
| 1 | 1.6692056 |
| 51 | 0.052155739 |
| 101 | 0.153771663 |
| 151 | 0.140569826 |
| 201 | 0.0806346475 |
| 251 | 0.0335702987 |
| 301 | 0.0288261325 |
| 351 | 0.021524149 |
| 401 | 0.0177998365 |
| 451 | 0.0161535079 |
| 501 | 0.0150074403 |
| 551 | 0.0141602273 |
| 601 | 0.0135270102 |
| 651 | 0.0130224677 |
| 701 | 0.012680918 |
| 751 | 0.0125195211 |
| 801 | 0.012479871 |
| 851 | 0.0124798725 |
| 901 | 0.0124755796 |
| 951 | 0.0124595178 |
| 1001 | 0.0124584842 |
| 1051 | 0.0124550266 |
| 1101 | 0.0124535505 |
| 1151 | 0.0124574483 |
| 1201 | 0.0124552797 |
| 1251 | 0.012448382 |
| 1301 | 0.0124502768 |
| 1351 | 0.0124525141 |
| 1401 | 0.0124515965 |
| 1451 | 0.0124517349 |
| 1501 | 0.012448055 |
| 1551 | 0.0124534268 |
| 1601 | 0.012451507 |
| 1651 | 0.012453137 |
| 1701 | 0.0124478853 |
| 1751 | 0.0124486965 |
| 1801 | 0.0124518498 |
| 1851 | 0.0124520887 |
| 1901 | 0.0124440358 |
| 1951 | 0.0124422887 |
| 2001 | 0.0124403623 |
| 2051 | 0.0124378203 |
| 2101 | 0.0124358203 |
| 2151 | 0.0124324524 |
| 2201 | 0.0124344459 |
| 2251 | 0.0124350381 |
| 2301 | 0.0124301678 |
| 2351 | 0.0124340979 |
| 2401 | 0.0124355653 |
| 2451 | 0.0124337702 |
| 2501 | 0.0124322378 |
| 2551 | 0.0124361725 |
| 2601 | 0.0124330226 |
| 2651 | 0.012432377 |
| 2701 | 0.0124396531 |
| 2751 | 0.0124371132 |
| 2801 | 0.0124337711 |
| 2851 | 0.0124345759 |
| 2901 | 0.0124336344 |
| 2951 | 0.0124334196 |
| 3001 | 0.0124317743 |
| 3051 | 0.0124339073 |
| 3101 | 0.0124375027 |
| 3151 | 0.0124339283 |
| 3201 | 0.0124350856 |
| 3251 | 0.0124333175 |
| 3301 | 0.0124343259 |
| 3351 | 0.0124340802 |
| 3401 | 0.0124325272 |
| 3451 | 0.0124332042 |
| 3501 | 0.0124333113 |
| 3551 | 0.0124322762 |
| 3601 | 0.0124328296 |
| 3651 | 0.0124344375 |
| 3701 | 0.0124363361 |
| 3751 | 0.0124336343 |
| 3801 | 0.0124314121 |
| 3851 | 0.0124328466 |
| 3901 | 0.0124334891 |
| 3951 | 0.0124322699 |
| 4001 | 0.0124339616 |
| 4051 | 0.0124361264 |
| 4101 | 0.012438972 |
| 4151 | 0.0124301219 |
| 4201 | 0.0124320109 |
| 4251 | 0.0124358834 |
| 4301 | 0.0124365413 |
| 4351 | 0.0124358272 |
| 4401 | 0.0124317559 |
| 4451 | 0.0124324312 |
| 4501 | 0.0124361561 |
| 4551 | 0.0124360974 |
| 4601 | 0.0124314273 |
| 4651 | 0.0124334902 |
| 4701 | 0.0124332022 |
| 4751 | 0.0124337046 |
| 4801 | 0.0124320925 |
| 4851 | 0.012432562 |
| 4901 | 0.0124321838 |
| 4951 | 0.0124314185 |
| 5001 | 0.0124355376 |
| 5051 | 0.0124362885 |
| 5101 | 0.012431643 |
| 5151 | 0.0124346969 |
| 5201 | 0.0124365569 |
| 5251 | 0.0124310609 |
| 5301 | 0.0124326853 |
| 5351 | 0.0124371757 |
| 5401 | 0.0124341861 |
| 5451 | 0.0124310044 |
| 5501 | 0.0124354187 |
| 5551 | 0.0124361935 |
| 5601 | 0.0124322506 |
| 5651 | 0.0124317146 |
| 5701 | 0.0124363457 |
| 5751 | 0.0124360187 |
| 5801 | 0.0124336219 |
| 5851 | 0.0124345434 |
| 5901 | 0.0124375748 |
| 5951 | 0.0124353757 |
| 6001 | 0.0124312288 |
| 6051 | 0.0124335648 |
| 6101 | 0.0124370491 |
| 6151 | 0.0124299402 |
| 6201 | 0.012435439 |
| 6251 | 0.0124366814 |
| 6301 | 0.0124337597 |
| 6351 | 0.0124349955 |
| 6401 | 0.0124346694 |
| 6451 | 0.0124321889 |
| 6501 | 0.012434104 |
| 6551 | 0.0124361107 |
| 6601 | 0.0124339291 |
| 6651 | 0.0124323419 |
| 6701 | 0.0124338544 |
| 6751 | 0.0124349744 |
| 6801 | 0.0124312867 |
| 6851 | 0.0124359164 |
| 6901 | 0.0124347321 |
| 6951 | 0.0124337647 |
| 7001 | 0.0124323742 |
| 7051 | 0.0124384924 |
| 7101 | 0.0124365544 |
| 7151 | 0.0124356441 |
| 7201 | 0.0124323846 |
| 7251 | 0.0124326356 |
| 7301 | 0.0124362084 |
| 7351 | 0.0124315611 |
| 7401 | 0.0124332857 |
| 7451 | 0.0124376534 |
| 7501 | 0.0124348825 |
| 7551 | 0.0124333988 |
| 7601 | 0.0124310709 |
| 7651 | 0.0124345001 |
| 7701 | 0.0124358886 |
| 7751 | 0.0124311065 |
| 7801 | 0.0124326299 |
| 7851 | 0.0124369097 |
| 7901 | 0.0124363221 |
| 7951 | 0.0124330719 |
| 8001 | 0.0124336443 |
| 8051 | 0.0124355968 |
| 8101 | 0.0124350587 |
| 8151 | 0.012433432 |
| 8201 | 0.0124336594 |
| 8251 | 0.012436984 |
| 8301 | 0.0124362663 |
| 8351 | 0.0124356075 |
| 8401 | 0.0124349567 |
| 8451 | 0.0124345269 |
| 8501 | 0.0124322424 |
| 8551 | 0.0124345102 |
| 8601 | 0.0124369158 |
| 8651 | 0.0124348057 |
| 8701 | 0.0124317283 |
| 8751 | 0.0124336393 |
| 8801 | 0.012430449 |
| 8851 | 0.0124304873 |
| 8901 | 0.0124350578 |
| 8951 | 0.0124344418 |
| 9001 | 0.0124315376 |
| 9051 | 0.0124342793 |
| 9101 | 0.012436517 |
| 9151 | 0.0124348988 |
| 9201 | 0.0124331639 |
| 9251 | 0.0124341136 |
| 9301 | 0.0124388866 |
| 9351 | 0.0124319154 |
| 9401 | 0.0124300549 |
| 9451 | 0.0124337122 |
| 9501 | 0.012435127 |
| 9551 | 0.0124365808 |
| 9601 | 0.012433463 |
| 9651 | 0.0124321461 |
| 9701 | 0.0124355491 |
| 9751 | 0.0124365072 |
| 9801 | 0.0124306471 |
| 9851 | 0.0124338652 |
| 9901 | 0.012435428 |
| 9951 | 0.0124315051 |
| 10001 | 0.0124336283 |
| 10051 | 0.0124357528 |
| 10101 | 0.0124342794 |
| 10151 | 0.0124360738 |
| 10201 | 0.0124344315 |
| 10251 | 0.0124372361 |
| 10301 | 0.0124353742 |
| 10351 | 0.0124317223 |
| 10401 | 0.0124359466 |
| 10451 | 0.0124347082 |
| 10501 | 0.0124317732 |
| 10551 | 0.0124330101 |
| 10601 | 0.0124379376 |
| 10651 | 0.0124359216 |
| 10701 | 0.0124318995 |
| 10751 | 0.0124356206 |
| 10801 | 0.0124351066 |
| 10851 | 0.012430845 |
| 10901 | 0.0124342562 |
| 10951 | 0.0124341266 |
| 11001 | 0.0124330045 |
| 11051 | 0.0124311614 |
| 11101 | 0.0124356831 |
| 11151 | 0.0124391636 |
| 11201 | 0.0124331106 |
| 11251 | 0.0124306988 |
| 11301 | 0.0124358905 |
| 11351 | 0.012434337 |
| 11401 | 0.0124307786 |
| 11451 | 0.0124337722 |
| 11501 | 0.0124361146 |
| 11551 | 0.0124323517 |
| 11601 | 0.0124336279 |
| 11651 | 0.012435652 |
| 11701 | 0.0124335687 |
| 11751 | 0.0124339611 |
| 11801 | 0.0124336343 |
| 11851 | 0.0124354791 |
| 11901 | 0.0124298501 |
| 11951 | 0.0124330037 |
| 12001 | 0.0124361216 |
| 12051 | 0.0124321905 |
| 12101 | 0.0124318346 |
| 12151 | 0.0124368175 |
| 12201 | 0.0124364616 |
| 12251 | 0.0124336156 |
| 12301 | 0.0124320864 |
| 12351 | 0.0124343768 |
| 12401 | 0.0124360317 |
| 12451 | 0.0124322324 |
| 12501 | 0.0124298499 |
| 12551 | 0.012433506 |
| 12601 | 0.0124353565 |
| 12651 | 0.0124315769 |
| 12701 | 0.0124342161 |
| 12751 | 0.012435996 |
| 12801 | 0.0124341605 |
| 12851 | 0.0124329632 |
| 12901 | 0.0124339985 |
| 12951 | 0.0124353824 |
| 13001 | 0.0124340593 |
| 13051 | 0.0124329941 |
| 13101 | 0.0124343117 |
| 13151 | 0.0124358237 |
| 13201 | 0.0124335641 |
| 13251 | 0.0124332637 |
| 13301 | 0.0124342281 |
| 13351 | 0.0124357921 |
| 13401 | 0.0124317499 |
| 13451 | 0.0124351456 |
| 13501 | 0.0124353696 |
| 13551 | 0.0124312047 |
| 13601 | 0.0124336471 |
| 13651 | 0.0124349103 |
| 13701 | 0.0124327119 |
| 13751 | 0.012431975 |
| 13801 | 0.0124348476 |
| 13851 | 0.0124352142 |
| 13901 | 0.0124312334 |
| 13951 | 0.0124346381 |
| 14001 | 0.0124353845 |
| 14051 | 0.0124299632 |
| 14101 | 0.0124327866 |
| 14151 | 0.012436101 |
| 14201 | 0.0124343157 |
| 14251 | 0.0124293548 |
| 14301 | 0.0124315711 |
| 14351 | 0.012439331 |
| 14401 | 0.012435916 |
| 14451 | 0.012433826 |
| 14501 | 0.0124327858 |
| 14551 | 0.0124349506 |
| 14601 | 0.0124332739 |
| 14651 | 0.0124325601 |
| 14701 | 0.0124357857 |
| 14751 | 0.0124334901 |
| 14801 | 0.0124307201 |
| 14851 | 0.0124357051 |
| 14901 | 0.0124366244 |
| 14951 | 0.0124305028 |
| 15001 | 0.0124331801 |
| 15051 | 0.0124357762 |
| 15101 | 0.0124378245 |
| 15151 | 0.0124316465 |
| 15201 | 0.0124354496 |
| 15251 | 0.0124380345 |
| 15301 | 0.0124319803 |
| 15351 | 0.0124309334 |
| 15401 | 0.0124325103 |
| 15451 | 0.012433446 |
| 15501 | 0.0124345784 |
| 15551 | 0.0124317366 |
| 15601 | 0.012436798 |
| 15651 | 0.0124378827 |
| 15701 | 0.0124346226 |
| 15751 | 0.0124346919 |
| 15801 | 0.0124308076 |
| 15851 | 0.0124325785 |
| 15901 | 0.0124354011 |
| 15951 | 0.0124332052 |
| 16001 | 0.0124314555 |
| 16051 | 0.0124380273 |
| 16101 | 0.0124343967 |
| 16151 | 0.0124320648 |
| 16201 | 0.0124357069 |
| 16251 | 0.012436532 |
| 16301 | 0.0124317884 |
| 16351 | 0.0124293415 |
| 16401 | 0.0124281876 |
| 16451 | 0.0124253589 |
| 16501 | 0.0124218459 |
| 16551 | 0.0124164213 |
| 16601 | 0.0124206208 |
| 16651 | 0.0124187105 |
| 16701 | 0.0124181253 |
| 16751 | 0.0124127909 |
| 16801 | 0.0124180864 |
| 16851 | 0.0124157346 |
| 16901 | 0.0124208231 |
| 16951 | 0.0124184619 |
| 17001 | 0.0124159767 |
| 17051 | 0.0124186216 |
| 17101 | 0.0124224415 |
| 17151 | 0.0124205403 |
| 17201 | 0.0124181079 |
| 17251 | 0.0124191275 |
| 17301 | 0.0124192121 |
| 17351 | 0.0124208334 |
| 17401 | 0.0124174622 |
| 17451 | 0.0124150762 |
| 17501 | 0.0124194935 |
| 17551 | 0.0124201306 |
| 17601 | 0.0124166807 |
| 17651 | 0.0124136405 |
| 17701 | 0.0124196148 |
| 17751 | 0.0124180387 |
| 17801 | 0.0124175417 |
| 17851 | 0.0124170508 |
| 17901 | 0.0124185476 |
| 17951 | 0.0124178856 |
| 18001 | 0.0124185014 |
| 18051 | 0.01241791 |
| 18101 | 0.012420614 |
| 18151 | 0.0124197592 |
| 18201 | 0.0124156395 |
| 18251 | 0.0124171319 |
| 18301 | 0.0124170474 |
| 18351 | 0.0124217359 |
| 18401 | 0.0124199352 |
| 18451 | 0.012416137 |
| 18501 | 0.0124159734 |
| 18551 | 0.0124206848 |
| 18601 | 0.0124172837 |
| 18651 | 0.0124161794 |
| 18701 | 0.012422591 |
| 18751 | 0.0124178973 |
| 18801 | 0.0124176639 |
| 18851 | 0.0124148003 |
| 18901 | 0.0124212905 |
| 18951 | 0.0124207117 |
| 19001 | 0.0124179396 |
| 19051 | 0.0124184767 |
| 19101 | 0.0124176235 |
| 19151 | 0.0124235319 |
| 19201 | 0.0124200375 |
| 19251 | 0.0124190953 |
| 19301 | 0.0124165342 |
| 19351 | 0.0124190408 |
| 19401 | 0.0124171698 |
| 19451 | 0.0124174699 |
| 19501 | 0.0124158261 |
| 19551 | 0.0124181679 |
| 19601 | 0.0124194864 |
| 19651 | 0.0124178335 |
| 19701 | 0.0124186864 |
| 19751 | 0.0124213984 |
| 19801 | 0.0124180081 |
| 19851 | 0.0124175766 |
| 19901 | 0.012416355 |
| 19951 | 0.012423418 |
| 20000 | 0.0124208605 |
6Mesh
| Cells (grid used for the pressure plots) | 48,120 |
|---|---|
| y+ max / mean | 1.65 / 0.54 |
| Max non-orthogonality | 71.9° |
| Max skewness | 1.69 |
| Max aspect ratio | 505 |
| checkMesh verdict | “Mesh OK.” |
| Grid | Cells | Lift coefficient | y+ max | Max aspect ratio | Max non-orthogonality | Max skewness | checkMesh |
|---|---|---|---|---|---|---|---|
| fs2-r10 (coarse) | 48,120 | 1.08028 | 1.65 | 505 | 71.9° | 1.69 | “Mesh OK.” |
| fs2-r15 (medium) | 108,540 | 1.08840 | 1.11 | 765 | 58.1° | 1.36 | “Mesh OK.” |
| fs2-r20 (fine) | 193,200 | 1.09212 | 0.85 | 1457.6 (12 cells) | 52.5° | 1.15 | “Failed 1 mesh checks.” |
The finest grid was solved despite its failed check, and the failure is not explained in any case note. Its lift enters the order and the GCI below, so both carry that caveat.
7Results
Lift converges monotonically, 1.08028, 1.08840, 1.09212, to an extrapolated 1.10083: +2.14 % above CFL3D (1.07781). Corrected for the grid, the lift over the angle range sits +3.41 to +3.77 % above the Ladson experiment, flat with angle.
Data table (3 rows)
| Cells | Simulation, k-omega SST | Extrapolated to zero cell size | CFL3D, NASA TMR (computation) | Ladson experiment, interpolated to 10 degrees |
|---|---|---|---|---|
| 48120 | 1.08028 | 1.10083 | 1.0778080613 | 1.0628 |
| 108540 | 1.0884 | 1.10083 | 1.0778080613 | 1.0628 |
| 193200 | 1.09212 | 1.10083 | 1.0778080613 | 1.0628 |
Data tables, one per series (24 points, 200 points, 199 points, 257 points, 257 points)
| x/c | Experiment, Gregory and O'Reilly (upper surface) |
|---|---|
| 0 | 3.66423 |
| 0.00218341 | 5.04375 |
| 0.00873362 | 5.24068 |
| 0.0131004 | 4.67125 |
| 0.0174672 | 4.32079 |
| 0.0480349 | 2.74347 |
| 0.0742358 | 2.26115 |
| 0.0982533 | 1.95405 |
| 0.124454 | 1.7345 |
| 0.146288 | 1.55884 |
| 0.176856 | 1.36109 |
| 0.28821 | 1.00829 |
| 0.320961 | 0.941877 |
| 0.384279 | 0.787206 |
| 0.447598 | 0.654432 |
| 0.515284 | 0.543461 |
| 0.576419 | 0.432633 |
| 0.637555 | 0.343703 |
| 0.700873 | 0.254725 |
| 0.766376 | 0.1657 |
| 0.831878 | 0.098572 |
| 0.893013 | 0.00964205 |
| 0.958515 | -0.0793835 |
| 1 | -0.124088 |
| x/c | Simulation, upper surface |
|---|---|
| 0.000031 | 4.102892 |
| 0.000156 | 4.559751 |
| 0.000405 | 4.940421 |
| 0.000778 | 5.234669 |
| 0.001275 | 5.443217 |
| 0.001897 | 5.558116 |
| 0.002643 | 5.592387 |
| 0.003512 | 5.560693 |
| 0.004506 | 5.476941 |
| 0.005622 | 5.354767 |
| 0.006862 | 5.206331 |
| 0.008224 | 5.040746 |
| 0.009709 | 4.866751 |
| 0.011316 | 4.690018 |
| 0.013044 | 4.513587 |
| 0.014894 | 4.340668 |
| 0.016865 | 4.173141 |
| 0.018956 | 4.01278 |
| 0.021166 | 3.859567 |
| 0.023496 | 3.714015 |
| 0.025944 | 3.575824 |
| 0.028511 | 3.445345 |
| 0.031195 | 3.322176 |
| 0.033995 | 3.205868 |
| 0.036912 | 3.096162 |
| 0.039943 | 2.992552 |
| 0.04309 | 2.894681 |
| 0.04635 | 2.802269 |
| 0.049723 | 2.714665 |
| 0.053208 | 2.631919 |
| 0.056804 | 2.553373 |
| 0.060511 | 2.478847 |
| 0.064327 | 2.40814 |
| 0.068251 | 2.340795 |
| 0.072283 | 2.276711 |
| 0.076422 | 2.215667 |
| 0.080666 | 2.157306 |
| 0.085014 | 2.101571 |
| 0.089465 | 2.048297 |
| 0.094019 | 1.997207 |
| 0.098674 | 1.948194 |
| 0.103429 | 1.90126 |
| 0.108282 | 1.856082 |
| 0.113233 | 1.812467 |
| 0.11828 | 1.770651 |
| 0.123422 | 1.730325 |
| 0.128658 | 1.691317 |
| 0.133986 | 1.65353 |
| 0.139405 | 1.61719 |
| 0.144915 | 1.581981 |
| 0.150512 | 1.547777 |
| 0.156196 | 1.514537 |
| 0.161966 | 1.482444 |
| 0.16782 | 1.451312 |
| 0.173757 | 1.420918 |
| 0.179775 | 1.391304 |
| 0.185873 | 1.362527 |
| 0.192048 | 1.334601 |
| 0.198301 | 1.307366 |
| 0.204628 | 1.280682 |
| 0.211029 | 1.254632 |
| 0.217502 | 1.229234 |
| 0.224045 | 1.204514 |
| 0.230657 | 1.180339 |
| 0.237336 | 1.156605 |
| 0.24408 | 1.133344 |
| 0.250887 | 1.110593 |
| 0.257757 | 1.0884 |
| 0.264687 | 1.066695 |
| 0.271675 | 1.04537 |
| 0.278721 | 1.02439 |
| 0.285821 | 1.003814 |
| 0.292974 | 0.983651 |
| 0.300179 | 0.963923 |
| 0.307434 | 0.944597 |
| 0.314736 | 0.925569 |
| 0.322085 | 0.906838 |
| 0.329477 | 0.888415 |
| 0.336913 | 0.870335 |
| 0.344388 | 0.852594 |
| 0.351902 | 0.835213 |
| 0.359453 | 0.818108 |
| 0.367039 | 0.80125 |
| 0.374658 | 0.784644 |
| 0.382308 | 0.768302 |
| 0.389988 | 0.752231 |
| 0.397694 | 0.736449 |
| 0.405426 | 0.720951 |
| 0.413181 | 0.705696 |
| 0.420958 | 0.690646 |
| 0.428755 | 0.675812 |
| 0.436569 | 0.661198 |
| 0.444398 | 0.646803 |
| 0.452242 | 0.632638 |
| 0.460097 | 0.618723 |
| 0.467962 | 0.605009 |
| 0.475835 | 0.591492 |
| 0.483714 | 0.578157 |
| 0.491597 | 0.565008 |
| 0.499481 | 0.552044 |
| 0.507366 | 0.539258 |
| 0.515249 | 0.526654 |
| 0.523127 | 0.514242 |
| 0.531 | 0.502016 |
| 0.538865 | 0.489951 |
| 0.546721 | 0.478038 |
| 0.554564 | 0.466268 |
| 0.562394 | 0.454652 |
| 0.570208 | 0.44318 |
| 0.578004 | 0.431854 |
| 0.585781 | 0.420668 |
| 0.593536 | 0.409632 |
| 0.601268 | 0.39874 |
| 0.608975 | 0.387975 |
| 0.616654 | 0.377325 |
| 0.624304 | 0.366792 |
| 0.631923 | 0.356379 |
| 0.639509 | 0.346071 |
| 0.64706 | 0.335874 |
| 0.654574 | 0.325781 |
| 0.66205 | 0.315794 |
| 0.669485 | 0.305911 |
| 0.676878 | 0.296129 |
| 0.684226 | 0.286443 |
| 0.691529 | 0.276838 |
| 0.698783 | 0.267307 |
| 0.705988 | 0.257856 |
| 0.713142 | 0.248484 |
| 0.720242 | 0.239188 |
| 0.727287 | 0.229964 |
| 0.734275 | 0.22081 |
| 0.741205 | 0.211728 |
| 0.748075 | 0.202716 |
| 0.754883 | 0.193768 |
| 0.761627 | 0.18488 |
| 0.768306 | 0.176047 |
| 0.774917 | 0.167266 |
| 0.78146 | 0.158538 |
| 0.787933 | 0.149862 |
| 0.794334 | 0.141243 |
| 0.800662 | 0.132681 |
| 0.806914 | 0.124176 |
| 0.81309 | 0.115728 |
| 0.819187 | 0.107338 |
| 0.825205 | 0.099005 |
| 0.831142 | 0.090727 |
| 0.836996 | 0.082504 |
| 0.842766 | 0.074339 |
| 0.84845 | 0.066231 |
| 0.854048 | 0.058184 |
| 0.859557 | 0.050201 |
| 0.864976 | 0.042288 |
| 0.870305 | 0.034449 |
| 0.87554 | 0.026691 |
| 0.880682 | 0.019018 |
| 0.88573 | 0.011435 |
| 0.89068 | 0.003943 |
| 0.895534 | -0.003455 |
| 0.900288 | -0.010752 |
| 0.904943 | -0.017943 |
| 0.909497 | -0.025024 |
| 0.913949 | -0.031987 |
| 0.918297 | -0.038828 |
| 0.922541 | -0.045541 |
| 0.926679 | -0.052119 |
| 0.930711 | -0.058559 |
| 0.934635 | -0.064855 |
| 0.938451 | -0.071001 |
| 0.942158 | -0.076994 |
| 0.945754 | -0.082825 |
| 0.94924 | -0.088491 |
| 0.952613 | -0.093987 |
| 0.955873 | -0.099309 |
| 0.959019 | -0.104452 |
| 0.962051 | -0.109414 |
| 0.964967 | -0.114191 |
| 0.967768 | -0.118786 |
| 0.970452 | -0.123194 |
| 0.973018 | -0.127417 |
| 0.975466 | -0.131457 |
| 0.977796 | -0.135314 |
| 0.980007 | -0.13899 |
| 0.982098 | -0.142487 |
| 0.984068 | -0.145809 |
| 0.985918 | -0.148958 |
| 0.987646 | -0.151938 |
| 0.989253 | -0.154753 |
| 0.990738 | -0.157405 |
| 0.992101 | -0.159891 |
| 0.99334 | -0.162227 |
| 0.994457 | -0.164377 |
| 0.99545 | -0.166413 |
| 0.99632 | -0.168165 |
| 0.997065 | -0.169939 |
| 0.997687 | -0.171046 |
| 0.998185 | -0.172656 |
| 0.998558 | -0.17255 |
| 0.998807 | -0.174522 |
| 0.998931 | -0.172977 |
| 0.999481 | -0.177815 |
| x/c | Simulation, lower surface |
|---|---|
| 0.000031 | 3.606992 |
| 0.000156 | 3.083456 |
| 0.000405 | 2.549545 |
| 0.000778 | 2.022579 |
| 0.001275 | 1.522047 |
| 0.001897 | 1.063567 |
| 0.002643 | 0.655259 |
| 0.003512 | 0.305177 |
| 0.004506 | 0.008394 |
| 0.005622 | -0.236341 |
| 0.006862 | -0.43442 |
| 0.008224 | -0.591968 |
| 0.009709 | -0.715006 |
| 0.011316 | -0.809173 |
| 0.013044 | -0.879502 |
| 0.014894 | -0.930353 |
| 0.016865 | -0.965419 |
| 0.018956 | -0.987777 |
| 0.021166 | -0.999924 |
| 0.023496 | -1.003962 |
| 0.025944 | -1.00171 |
| 0.028511 | -0.994371 |
| 0.031195 | -0.982991 |
| 0.033995 | -0.968568 |
| 0.036912 | -0.951784 |
| 0.039943 | -0.933244 |
| 0.04309 | -0.913406 |
| 0.04635 | -0.892662 |
| 0.049723 | -0.871296 |
| 0.053208 | -0.849576 |
| 0.056804 | -0.827665 |
| 0.060511 | -0.805757 |
| 0.064327 | -0.783917 |
| 0.068251 | -0.762298 |
| 0.072283 | -0.740917 |
| 0.076422 | -0.72014 |
| 0.080666 | -0.699902 |
| 0.085014 | -0.679935 |
| 0.089465 | -0.660146 |
| 0.094019 | -0.640776 |
| 0.098674 | -0.621912 |
| 0.103429 | -0.603556 |
| 0.108282 | -0.585707 |
| 0.113233 | -0.568362 |
| 0.11828 | -0.551519 |
| 0.123422 | -0.535168 |
| 0.128658 | -0.519306 |
| 0.133986 | -0.503922 |
| 0.139405 | -0.489007 |
| 0.144915 | -0.474562 |
| 0.150512 | -0.460567 |
| 0.156196 | -0.447015 |
| 0.161966 | -0.433889 |
| 0.16782 | -0.421219 |
| 0.173757 | -0.408911 |
| 0.179775 | -0.397055 |
| 0.185873 | -0.385585 |
| 0.192048 | -0.374473 |
| 0.198301 | -0.363743 |
| 0.204628 | -0.353392 |
| 0.211029 | -0.343402 |
| 0.217502 | -0.333715 |
| 0.224045 | -0.324396 |
| 0.230657 | -0.315415 |
| 0.237336 | -0.306723 |
| 0.24408 | -0.298328 |
| 0.250887 | -0.290239 |
| 0.257757 | -0.28248 |
| 0.264687 | -0.274963 |
| 0.271675 | -0.267714 |
| 0.278721 | -0.26071 |
| 0.285821 | -0.254012 |
| 0.292974 | -0.247567 |
| 0.300179 | -0.241309 |
| 0.307434 | -0.235297 |
| 0.314736 | -0.229499 |
| 0.322085 | -0.223959 |
| 0.329477 | -0.218636 |
| 0.336913 | -0.213464 |
| 0.344388 | -0.208498 |
| 0.351902 | -0.203714 |
| 0.359453 | -0.199147 |
| 0.367039 | -0.194765 |
| 0.374658 | -0.190531 |
| 0.382308 | -0.186435 |
| 0.389988 | -0.182513 |
| 0.397694 | -0.178735 |
| 0.405426 | -0.175137 |
| 0.413181 | -0.171684 |
| 0.420958 | -0.168347 |
| 0.428755 | -0.165122 |
| 0.436569 | -0.162032 |
| 0.444398 | -0.159057 |
| 0.452242 | -0.156218 |
| 0.460097 | -0.153506 |
| 0.467962 | -0.150894 |
| 0.475835 | -0.14837 |
| 0.483714 | -0.14594 |
| 0.491597 | -0.14361 |
| 0.499481 | -0.141369 |
| 0.507366 | -0.139226 |
| 0.515249 | -0.13718 |
| 0.523127 | -0.135218 |
| 0.531 | -0.133329 |
| 0.538865 | -0.131506 |
| 0.546721 | -0.129756 |
| 0.554564 | -0.128077 |
| 0.562394 | -0.126466 |
| 0.570208 | -0.124925 |
| 0.578004 | -0.123457 |
| 0.585781 | -0.12205 |
| 0.593536 | -0.120701 |
| 0.601268 | -0.11941 |
| 0.608975 | -0.118175 |
| 0.616654 | -0.116987 |
| 0.624304 | -0.115857 |
| 0.631923 | -0.114775 |
| 0.639509 | -0.11375 |
| 0.64706 | -0.112776 |
| 0.654574 | -0.111855 |
| 0.66205 | -0.110976 |
| 0.669485 | -0.110148 |
| 0.676878 | -0.109364 |
| 0.684226 | -0.108632 |
| 0.691529 | -0.107941 |
| 0.698783 | -0.107298 |
| 0.705988 | -0.106694 |
| 0.713142 | -0.106139 |
| 0.720242 | -0.10563 |
| 0.727287 | -0.105167 |
| 0.734275 | -0.104745 |
| 0.741205 | -0.104369 |
| 0.748075 | -0.104037 |
| 0.754883 | -0.103753 |
| 0.761627 | -0.103515 |
| 0.768306 | -0.103324 |
| 0.774917 | -0.103181 |
| 0.78146 | -0.103082 |
| 0.787933 | -0.103034 |
| 0.794334 | -0.103036 |
| 0.800662 | -0.103083 |
| 0.806914 | -0.103179 |
| 0.81309 | -0.103325 |
| 0.819187 | -0.103522 |
| 0.825205 | -0.103772 |
| 0.831142 | -0.104074 |
| 0.836996 | -0.104429 |
| 0.842766 | -0.10484 |
| 0.84845 | -0.105307 |
| 0.854048 | -0.105829 |
| 0.859557 | -0.106408 |
| 0.864976 | -0.107044 |
| 0.870305 | -0.107739 |
| 0.87554 | -0.108493 |
| 0.880682 | -0.10931 |
| 0.88573 | -0.11019 |
| 0.89068 | -0.111134 |
| 0.895534 | -0.112142 |
| 0.900288 | -0.113215 |
| 0.904943 | -0.114355 |
| 0.909497 | -0.11556 |
| 0.913949 | -0.116832 |
| 0.918297 | -0.118174 |
| 0.922541 | -0.119586 |
| 0.926679 | -0.121068 |
| 0.930711 | -0.122622 |
| 0.934635 | -0.124248 |
| 0.938451 | -0.125949 |
| 0.942158 | -0.127725 |
| 0.945754 | -0.129576 |
| 0.94924 | -0.131504 |
| 0.952613 | -0.133509 |
| 0.955873 | -0.135593 |
| 0.959019 | -0.137755 |
| 0.962051 | -0.139996 |
| 0.964967 | -0.142316 |
| 0.967768 | -0.144715 |
| 0.970452 | -0.147192 |
| 0.973018 | -0.149747 |
| 0.975466 | -0.152378 |
| 0.977796 | -0.155085 |
| 0.980007 | -0.157863 |
| 0.982098 | -0.160714 |
| 0.984068 | -0.163631 |
| 0.985918 | -0.166617 |
| 0.987646 | -0.169664 |
| 0.989253 | -0.172775 |
| 0.990738 | -0.175944 |
| 0.992101 | -0.179183 |
| 0.99334 | -0.182469 |
| 0.994457 | -0.185847 |
| 0.99545 | -0.189212 |
| 0.99632 | -0.192826 |
| 0.997065 | -0.195889 |
| 0.997687 | -0.200354 |
| 0.998185 | -0.201278 |
| 0.998558 | -0.209024 |
| 0.998807 | -0.203645 |
| 0.99945 | -0.231297 |
| x/c | CFL3D, upper surface |
|---|---|
| 0 | 3.7708 |
| 3.2412e-7 | 3.8155 |
| 0.0000013469 | 3.8438 |
| 0.0000031491 | 3.8826 |
| 0.0000058186 | 3.9225 |
| 0.0000094511 | 3.9644 |
| 0.000014151 | 4.0078 |
| 0.00002003 | 4.0526 |
| 0.000027213 | 4.099 |
| 0.000035831 | 4.1467 |
| 0.000046029 | 4.1958 |
| 0.000057964 | 4.2463 |
| 0.000071803 | 4.2979 |
| 0.00008773 | 4.3507 |
| 0.00010594 | 4.4047 |
| 0.00012665 | 4.4596 |
| 0.00015008 | 4.5154 |
| 0.00017648 | 4.5721 |
| 0.00020611 | 4.6295 |
| 0.00023927 | 4.6874 |
| 0.00027624 | 4.7458 |
| 0.00031735 | 4.8045 |
| 0.00036295 | 4.8631 |
| 0.00041342 | 4.9217 |
| 0.00046913 | 4.9798 |
| 0.00053051 | 5.0372 |
| 0.00059799 | 5.0938 |
| 0.00067206 | 5.149 |
| 0.00075319 | 5.2026 |
| 0.00084191 | 5.2544 |
| 0.00093876 | 5.304 |
| 0.0010443 | 5.3509 |
| 0.0011592 | 5.395 |
| 0.001284 | 5.4357 |
| 0.0014194 | 5.4727 |
| 0.001566 | 5.5058 |
| 0.0017246 | 5.5345 |
| 0.0018959 | 5.5587 |
| 0.0020806 | 5.5779 |
| 0.0022795 | 5.5919 |
| 0.0024934 | 5.6006 |
| 0.0027231 | 5.6038 |
| 0.0029694 | 5.6013 |
| 0.0032332 | 5.5931 |
| 0.0035153 | 5.5792 |
| 0.0038166 | 5.5597 |
| 0.004138 | 5.5345 |
| 0.0044803 | 5.5039 |
| 0.0048446 | 5.468 |
| 0.0052316 | 5.427 |
| 0.0056425 | 5.3813 |
| 0.006078 | 5.3309 |
| 0.0065393 | 5.2763 |
| 0.0070272 | 5.2178 |
| 0.0075428 | 5.1558 |
| 0.008087 | 5.0906 |
| 0.008661 | 5.0223 |
| 0.0092657 | 4.9516 |
| 0.0099023 | 4.879 |
| 0.010572 | 4.8038 |
| 0.011275 | 4.7278 |
| 0.012014 | 4.6504 |
| 0.012789 | 4.5716 |
| 0.013601 | 4.4929 |
| 0.014452 | 4.4133 |
| 0.015343 | 4.3334 |
| 0.016276 | 4.2535 |
| 0.01725 | 4.1739 |
| 0.018269 | 4.0947 |
| 0.019333 | 4.016 |
| 0.020443 | 3.9379 |
| 0.021601 | 3.8606 |
| 0.022809 | 3.7842 |
| 0.024068 | 3.7088 |
| 0.02538 | 3.6343 |
| 0.026746 | 3.5611 |
| 0.028167 | 3.489 |
| 0.029646 | 3.4181 |
| 0.031184 | 3.3484 |
| 0.032783 | 3.2801 |
| 0.034445 | 3.213 |
| 0.036171 | 3.1472 |
| 0.037964 | 3.0827 |
| 0.039825 | 3.0195 |
| 0.041756 | 2.9577 |
| 0.043759 | 2.8971 |
| 0.045837 | 2.8378 |
| 0.04799 | 2.7798 |
| 0.050222 | 2.723 |
| 0.052535 | 2.6675 |
| 0.05493 | 2.6132 |
| 0.05741 | 2.56 |
| 0.059977 | 2.5081 |
| 0.062633 | 2.4572 |
| 0.06538 | 2.4075 |
| 0.068221 | 2.3588 |
| 0.071158 | 2.3113 |
| 0.074194 | 2.2647 |
| 0.07733 | 2.2191 |
| 0.080568 | 2.1746 |
| 0.083912 | 2.1309 |
| 0.087364 | 2.0882 |
| 0.090925 | 2.0464 |
| 0.094598 | 2.0054 |
| 0.098386 | 1.9653 |
| 0.10229 | 1.926 |
| 0.10631 | 1.8875 |
| 0.11046 | 1.8497 |
| 0.11472 | 1.8127 |
| 0.11911 | 1.7764 |
| 0.12363 | 1.7407 |
| 0.12828 | 1.7058 |
| 0.13306 | 1.6715 |
| 0.13797 | 1.6378 |
| 0.14301 | 1.6047 |
| 0.14819 | 1.5722 |
| 0.15351 | 1.5403 |
| 0.15897 | 1.5089 |
| 0.16456 | 1.478 |
| 0.1703 | 1.4476 |
| 0.17618 | 1.4178 |
| 0.1822 | 1.3884 |
| 0.18837 | 1.3595 |
| 0.19467 | 1.3311 |
| 0.20112 | 1.3031 |
| 0.20772 | 1.2755 |
| 0.21446 | 1.2483 |
| 0.22134 | 1.2216 |
| 0.22837 | 1.1952 |
| 0.23553 | 1.1693 |
| 0.24284 | 1.1437 |
| 0.25029 | 1.1185 |
| 0.25787 | 1.0937 |
| 0.26559 | 1.0692 |
| 0.27345 | 1.045 |
| 0.28144 | 1.0213 |
| 0.28955 | 0.99783 |
| 0.2978 | 0.97473 |
| 0.30616 | 0.95197 |
| 0.31465 | 0.92954 |
| 0.32325 | 0.90745 |
| 0.33197 | 0.88568 |
| 0.34079 | 0.86422 |
| 0.34972 | 0.84309 |
| 0.35875 | 0.82228 |
| 0.36787 | 0.80179 |
| 0.37708 | 0.78161 |
| 0.38638 | 0.76175 |
| 0.39575 | 0.74219 |
| 0.4052 | 0.72294 |
| 0.41471 | 0.704 |
| 0.42428 | 0.68536 |
| 0.43391 | 0.66703 |
| 0.44359 | 0.649 |
| 0.45331 | 0.63126 |
| 0.46306 | 0.61383 |
| 0.47284 | 0.59668 |
| 0.48265 | 0.57982 |
| 0.49246 | 0.56325 |
| 0.50229 | 0.54697 |
| 0.51212 | 0.53096 |
| 0.52194 | 0.51524 |
| 0.53174 | 0.49978 |
| 0.54153 | 0.48459 |
| 0.55129 | 0.46966 |
| 0.56102 | 0.455 |
| 0.57071 | 0.44059 |
| 0.58035 | 0.42643 |
| 0.58993 | 0.41251 |
| 0.59946 | 0.39884 |
| 0.60892 | 0.38539 |
| 0.61831 | 0.37218 |
| 0.62763 | 0.35919 |
| 0.63686 | 0.34642 |
| 0.646 | 0.33386 |
| 0.65505 | 0.32151 |
| 0.66401 | 0.30937 |
| 0.67286 | 0.29742 |
| 0.6816 | 0.28567 |
| 0.69023 | 0.2741 |
| 0.69875 | 0.26271 |
| 0.70715 | 0.2515 |
| 0.71543 | 0.24046 |
| 0.72358 | 0.2296 |
| 0.7316 | 0.2189 |
| 0.7395 | 0.20836 |
| 0.74726 | 0.19798 |
| 0.75489 | 0.18775 |
| 0.76238 | 0.17767 |
| 0.76973 | 0.16775 |
| 0.77694 | 0.15797 |
| 0.78402 | 0.14834 |
| 0.79095 | 0.13884 |
| 0.79774 | 0.1295 |
| 0.80439 | 0.12029 |
| 0.8109 | 0.11122 |
| 0.81727 | 0.10229 |
| 0.82349 | 0.093501 |
| 0.82957 | 0.084849 |
| 0.83551 | 0.076335 |
| 0.84132 | 0.067964 |
| 0.84698 | 0.059736 |
| 0.8525 | 0.051645 |
| 0.85789 | 0.043698 |
| 0.86315 | 0.035894 |
| 0.86827 | 0.028238 |
| 0.87325 | 0.020725 |
| 0.87811 | 0.013355 |
| 0.88284 | 0.0061391 |
| 0.88744 | -0.0009287 |
| 0.89191 | -0.0078428 |
| 0.89626 | -0.014603 |
| 0.9005 | -0.021215 |
| 0.90461 | -0.027674 |
| 0.9086 | -0.033974 |
| 0.91249 | -0.040125 |
| 0.91626 | -0.046117 |
| 0.91991 | -0.05195 |
| 0.92347 | -0.057635 |
| 0.92691 | -0.063167 |
| 0.93025 | -0.068539 |
| 0.9335 | -0.073763 |
| 0.93664 | -0.078839 |
| 0.93969 | -0.083761 |
| 0.94264 | -0.088534 |
| 0.9455 | -0.093165 |
| 0.94827 | -0.097647 |
| 0.95096 | -0.10199 |
| 0.95356 | -0.1062 |
| 0.95608 | -0.11027 |
| 0.95852 | -0.1142 |
| 0.96087 | -0.118 |
| 0.96316 | -0.12167 |
| 0.96537 | -0.12522 |
| 0.9675 | -0.12866 |
| 0.96957 | -0.13197 |
| 0.97157 | -0.13516 |
| 0.9735 | -0.13825 |
| 0.97537 | -0.14124 |
| 0.97718 | -0.14412 |
| 0.97892 | -0.1469 |
| 0.98061 | -0.1496 |
| 0.98224 | -0.15222 |
| 0.98381 | -0.15476 |
| 0.98534 | -0.15724 |
| 0.98681 | -0.15966 |
| 0.98823 | -0.16203 |
| 0.9896 | -0.16432 |
| 0.99092 | -0.16656 |
| 0.9922 | -0.16866 |
| 0.99344 | -0.17062 |
| 0.99463 | -0.1723 |
| 0.99578 | -0.17386 |
| 0.99689 | -0.1745 |
| 0.99797 | -0.17586 |
| 0.999 | -0.17031 |
| 1 | -0.18499 |
| x/c | CFL3D, lower surface |
|---|---|
| 0 | 3.7708 |
| 3.2412e-7 | 3.7224 |
| 0.0000013469 | 3.6931 |
| 0.0000031491 | 3.656 |
| 0.0000058186 | 3.6149 |
| 0.0000094511 | 3.5719 |
| 0.000014151 | 3.5272 |
| 0.00002003 | 3.4807 |
| 0.000027213 | 3.4322 |
| 0.000035831 | 3.3815 |
| 0.000046029 | 3.3287 |
| 0.000057964 | 3.2735 |
| 0.000071803 | 3.216 |
| 0.00008773 | 3.1561 |
| 0.00010594 | 3.0936 |
| 0.00012665 | 3.0286 |
| 0.00015008 | 2.961 |
| 0.00017648 | 2.8908 |
| 0.00020611 | 2.8178 |
| 0.00023927 | 2.7422 |
| 0.00027624 | 2.6638 |
| 0.00031735 | 2.5826 |
| 0.00036295 | 2.4988 |
| 0.00041342 | 2.4122 |
| 0.00046913 | 2.3229 |
| 0.00053051 | 2.2311 |
| 0.00059799 | 2.1366 |
| 0.00067206 | 2.0397 |
| 0.00075319 | 1.9405 |
| 0.00084191 | 1.8392 |
| 0.00093876 | 1.7359 |
| 0.0010443 | 1.6308 |
| 0.0011592 | 1.5242 |
| 0.001284 | 1.4163 |
| 0.0014194 | 1.3075 |
| 0.001566 | 1.198 |
| 0.0017246 | 1.0882 |
| 0.0018959 | 0.97843 |
| 0.0020806 | 0.8691 |
| 0.0022795 | 0.76055 |
| 0.0024934 | 0.65318 |
| 0.0027231 | 0.54735 |
| 0.0029694 | 0.44345 |
| 0.0032332 | 0.34182 |
| 0.0035153 | 0.24282 |
| 0.0038166 | 0.14676 |
| 0.004138 | 0.053945 |
| 0.0044803 | -0.035378 |
| 0.0048446 | -0.12099 |
| 0.0052316 | -0.20267 |
| 0.0056425 | -0.28029 |
| 0.006078 | -0.3537 |
| 0.0065393 | -0.42283 |
| 0.0070272 | -0.48763 |
| 0.0075428 | -0.54809 |
| 0.008087 | -0.60422 |
| 0.008661 | -0.65607 |
| 0.0092657 | -0.70367 |
| 0.0099023 | -0.74723 |
| 0.010572 | -0.78671 |
| 0.011275 | -0.82231 |
| 0.012014 | -0.85423 |
| 0.012789 | -0.88251 |
| 0.013601 | -0.90739 |
| 0.014452 | -0.92902 |
| 0.015343 | -0.94757 |
| 0.016276 | -0.9632 |
| 0.01725 | -0.97608 |
| 0.018269 | -0.9864 |
| 0.019333 | -0.99431 |
| 0.020443 | -0.99997 |
| 0.021601 | -1.0035 |
| 0.022809 | -1.0052 |
| 0.024068 | -1.005 |
| 0.02538 | -1.0032 |
| 0.026746 | -0.99984 |
| 0.028167 | -0.99509 |
| 0.029646 | -0.98906 |
| 0.031184 | -0.98186 |
| 0.032783 | -0.97359 |
| 0.034445 | -0.96435 |
| 0.036171 | -0.95423 |
| 0.037964 | -0.94332 |
| 0.039825 | -0.93171 |
| 0.041756 | -0.91946 |
| 0.043759 | -0.90664 |
| 0.045837 | -0.89333 |
| 0.04799 | -0.87956 |
| 0.050222 | -0.86541 |
| 0.052535 | -0.85092 |
| 0.05493 | -0.83614 |
| 0.05741 | -0.82115 |
| 0.059977 | -0.80601 |
| 0.062633 | -0.79077 |
| 0.06538 | -0.77543 |
| 0.068221 | -0.76 |
| 0.071158 | -0.74445 |
| 0.074194 | -0.72882 |
| 0.07733 | -0.71313 |
| 0.080568 | -0.69746 |
| 0.083912 | -0.68182 |
| 0.087364 | -0.66625 |
| 0.090925 | -0.65077 |
| 0.094598 | -0.63539 |
| 0.098386 | -0.62013 |
| 0.10229 | -0.605 |
| 0.10631 | -0.59002 |
| 0.11046 | -0.57519 |
| 0.11472 | -0.56054 |
| 0.11911 | -0.54608 |
| 0.12363 | -0.5318 |
| 0.12828 | -0.51773 |
| 0.13306 | -0.50387 |
| 0.13797 | -0.49023 |
| 0.14301 | -0.47681 |
| 0.14819 | -0.46362 |
| 0.15351 | -0.45068 |
| 0.15897 | -0.43799 |
| 0.16456 | -0.42554 |
| 0.1703 | -0.41335 |
| 0.17618 | -0.40142 |
| 0.1822 | -0.38976 |
| 0.18837 | -0.37836 |
| 0.19467 | -0.36724 |
| 0.20112 | -0.35638 |
| 0.20772 | -0.3458 |
| 0.21446 | -0.3355 |
| 0.22134 | -0.32548 |
| 0.22837 | -0.31573 |
| 0.23553 | -0.30626 |
| 0.24284 | -0.29708 |
| 0.25029 | -0.28816 |
| 0.25787 | -0.27953 |
| 0.26559 | -0.27117 |
| 0.27345 | -0.26308 |
| 0.28144 | -0.25526 |
| 0.28955 | -0.24771 |
| 0.2978 | -0.24043 |
| 0.30616 | -0.23341 |
| 0.31465 | -0.22664 |
| 0.32325 | -0.22013 |
| 0.33197 | -0.21387 |
| 0.34079 | -0.20784 |
| 0.34972 | -0.20206 |
| 0.35875 | -0.19652 |
| 0.36787 | -0.1912 |
| 0.37708 | -0.1861 |
| 0.38638 | -0.18122 |
| 0.39575 | -0.17654 |
| 0.4052 | -0.17207 |
| 0.41471 | -0.1678 |
| 0.42428 | -0.16372 |
| 0.43391 | -0.15982 |
| 0.44359 | -0.1561 |
| 0.45331 | -0.15255 |
| 0.46306 | -0.14917 |
| 0.47284 | -0.14595 |
| 0.48265 | -0.14288 |
| 0.49246 | -0.13995 |
| 0.50229 | -0.13717 |
| 0.51212 | -0.13452 |
| 0.52194 | -0.132 |
| 0.53174 | -0.12961 |
| 0.54153 | -0.12733 |
| 0.55129 | -0.12517 |
| 0.56102 | -0.12312 |
| 0.57071 | -0.12118 |
| 0.58035 | -0.11933 |
| 0.58993 | -0.11758 |
| 0.59946 | -0.11593 |
| 0.60892 | -0.11436 |
| 0.61831 | -0.11288 |
| 0.62763 | -0.11149 |
| 0.63686 | -0.11017 |
| 0.646 | -0.10894 |
| 0.65505 | -0.10778 |
| 0.66401 | -0.10669 |
| 0.67286 | -0.10567 |
| 0.6816 | -0.10473 |
| 0.69023 | -0.10385 |
| 0.69875 | -0.10304 |
| 0.70715 | -0.10228 |
| 0.71543 | -0.1016 |
| 0.72358 | -0.10098 |
| 0.7316 | -0.10042 |
| 0.7395 | -0.099915 |
| 0.74726 | -0.099475 |
| 0.75489 | -0.099094 |
| 0.76238 | -0.098765 |
| 0.76973 | -0.098495 |
| 0.77694 | -0.098283 |
| 0.78402 | -0.098124 |
| 0.79095 | -0.098023 |
| 0.79774 | -0.09797 |
| 0.80439 | -0.097976 |
| 0.8109 | -0.098029 |
| 0.81727 | -0.098135 |
| 0.82349 | -0.098294 |
| 0.82957 | -0.098505 |
| 0.83551 | -0.09876 |
| 0.84132 | -0.099067 |
| 0.84698 | -0.099422 |
| 0.8525 | -0.099819 |
| 0.85789 | -0.10027 |
| 0.86315 | -0.10076 |
| 0.86827 | -0.1013 |
| 0.87325 | -0.10188 |
| 0.87811 | -0.1025 |
| 0.88284 | -0.10317 |
| 0.88744 | -0.10387 |
| 0.89191 | -0.10462 |
| 0.89626 | -0.1054 |
| 0.9005 | -0.10623 |
| 0.90461 | -0.10709 |
| 0.9086 | -0.10799 |
| 0.91249 | -0.10893 |
| 0.91626 | -0.1099 |
| 0.91991 | -0.1109 |
| 0.92347 | -0.11194 |
| 0.92691 | -0.11301 |
| 0.93025 | -0.11411 |
| 0.9335 | -0.11524 |
| 0.93664 | -0.1164 |
| 0.93969 | -0.1176 |
| 0.94264 | -0.11882 |
| 0.9455 | -0.12007 |
| 0.94827 | -0.12135 |
| 0.95096 | -0.12265 |
| 0.95356 | -0.12398 |
| 0.95608 | -0.12534 |
| 0.95852 | -0.12672 |
| 0.96087 | -0.12813 |
| 0.96316 | -0.12957 |
| 0.96537 | -0.13103 |
| 0.9675 | -0.13251 |
| 0.96957 | -0.13402 |
| 0.97157 | -0.13555 |
| 0.9735 | -0.13711 |
| 0.97537 | -0.13869 |
| 0.97718 | -0.1403 |
| 0.97892 | -0.14193 |
| 0.98061 | -0.14359 |
| 0.98224 | -0.14528 |
| 0.98381 | -0.14699 |
| 0.98534 | -0.14874 |
| 0.98681 | -0.15053 |
| 0.98823 | -0.15237 |
| 0.9896 | -0.15425 |
| 0.99092 | -0.15618 |
| 0.9922 | -0.15813 |
| 0.99344 | -0.16007 |
| 0.99463 | -0.16192 |
| 0.99578 | -0.16363 |
| 0.99689 | -0.16483 |
| 0.99797 | -0.16542 |
| 0.999 | -0.16471 |
| 1 | -0.1853 |
| Quantity | Reference | Simulation | Signed difference |
|---|---|---|---|
| Lift, extrapolated, vs CFL3D (computation) | 1.07781 | 1.10083 | +2.14 % |
| Lift at 10 degrees, grid-corrected, vs Ladson (experiment) | 1.0628 | – | +3.59 % |
| Lift, grid-corrected, 8 to 14 degrees, vs Ladson | – | – | +3.41 to +3.77 % |
| Suction peak Cp vs CFL3D, coarse grid | −5.60 | −5.5924 | 0.14 % smaller in magnitude |
The surface pressure follows CFL3D closely: the suction peak is −5.5924 against −5.60. Drag is not grid-converged (124.23, 122.45 and 123.38 drag counts on the three grids, down then up), so I give no drag result.
A NACA 4412 at high lift was also run with the same recipe. That run was made after the experimental value was known and with a changed set-up, so it is not a blind test; the one genuinely blind run used a recipe later found defective and is invalid. It is a single grid, its aft upper-surface pressure is wrong, and the experimental lift it was scored against is not stored on this machine, so it is not compared on this page.
8Numerical accuracy
Method: three-grid Richardson extrapolation with the unequal-ratio form (Celik et al.), run with the project's shared gci.py. On the five-digit lift values it gives an observed order of 1.241, an extrapolated 1.100768, a GCI of 0.990 % and an asymptotic check of 1.003. The freeze document's 1.10083 and 1.00 % come from the same data; the differences are input rounding.
Three grids give one value of the order and no way to check it, and the fine-grid force noise moves it noticeably, so the honest figures are p ≈ 1.2 ± 0.1 and GCI ≈ 1.0 ± 0.15 %. The order is well below the formal 2. An earlier GCI from a defective formula was retracted; the retraction is kept in the freeze document and in the ledger note below.
The grid correction for the polar uses a multiplier of 1.0190 from this ladder. Drag has no grid-convergence result.
Output of the shared GCI tool, unedited
Lift, three grids
GCI      N=(48120,108540,193200)  r21=1.3342 r32=1.5019  (unequal-ratio form: YES)
         f: coarse=1.080280 medium=1.088400 fine=1.092120
         observed order p = 1.241   (formal 2.0)
         Richardson f(h->0) = 1.100768
         GCI_fine = 0.990 %   (Fs=1.25 auto; approx. rel. err fine-vs-medium = 0.341 %)
         asymptotic check = 1.003  (want ~1.0)
         WARNING: 3-grid family: p has NO redundancy and is unverifiable. Quote p ~ 1.2 (+-0.1 under force-tail noise), not to 3 s.f. Use >=4 grids (gci_multi.py) for a checkable order.
From data/naca-0012/gci.json (gci_3grid), written by pipeline/build_assets.py.
9Why they differ, and what I distrust
Limits, as recorded in the ledger. An earlier GCI (p 1.91, 0.58 %) was wrong and is retracted; corrected p 1.24, band 1.0 %, 3 grids. The finest 0012 grid fails checkMesh on aspect ratio (1457, 12 cells, undocumented) and fine-grid force drift exceeds the freeze's own 1e-5 gate. Cd is not grid-converged. The 4412 figure is a re-run with a changed recipe after the experiment was known; the genuinely blind run (+6.4 %, band-pass) used a recipe later found defective and is invalid. The 4412 aft-upper Cp plateau fails. The experimental Cl 1.554 is not stored locally.
- The finest grid fails checkMesh on aspect ratio (12 cells) and the location of those cells was never documented; the order and GCI depend on that grid.
- Both finer grids drift more than my own convergence gate (3.9e-5 and 1.8e-5 against 1e-5).
- CFL3D is a compressible code at Mach 0.15 using a variant of SST; I solve incompressible with OpenFOAM's SST, so the +2.14 % is a code and model difference I have quantified but not explained.
- The pressure plots come from the coarse grid, not a grid-converged solution, and the Gregory and O'Reilly data are approximate and at a different Reynolds number.
- Drag is not grid-converged.
- The NACA 4412 run is not blind, is single-grid and fails the aft pressure plateau; its experimental lift has no source on disk.
10References
- NASA Turbulence Modeling Resource, 2-D NACA 0012 validation case: CFL3D SST results (n0012clcd_cfl3d_sst.dat, n0012cp_cfl3d_sst.dat), as stored locally.
- Ladson, NASA TM 4074, 1988: lift and drag at Re 6 million, transition tripped, M 0.15 (TMR file CLCD_Ladson_expdata.dat).
- Gregory & O'Reilly, NASA R&M 3726, Jan 1970: upper-surface pressure at Re 2.88 million, digitised (TMR file CP_Gregory_expdata.dat).
- Celik et al.: the unequal-ratio Richardson / GCI procedure, as implemented in the project's gci.py.
Source files
D:/CFD/airfoil/RUNG1-FREEZE.md (read with its ERRATUM)D:/CFD/airfoil/naca0012-fs2-r10/, fs2-r15/, fs2-r20/ (log.checkMesh, postProcessing/yPlus1)D:/CFD/airfoil/naca0012-final-a10/ (0/, constant/, system/, log.checkMesh, postProcessing/)D:/CFD/data/airfoil/tmr_naca0012/ (n0012cp_cfl3d_sst.dat, n0012clcd_cfl3d_sst.dat, CLCD_Ladson_expdata.dat, CP_Gregory_expdata.dat)investigation/lane-B-verification.md (evidence audit, drift recompute)site/public/data/naca-0012/ (surface_cp.csv, README.txt, chart JSON and gci.json from pipeline/case_data/naca-0012.py)
Last updated 2026-11-14. One-page summary (prints to one A4 page), also as a PDF. Every number on this page is checked against its source file by pipeline/check_numbers.py.