Windsor squareback: an extrapolation a fourth grid did not support
I ran the Windsor body (the AutoCFD / Loughborough wind-tunnel case, no wheels) on three grids and extrapolated a grid-independent drag 9.9 % below experiment. A fourth, coarser grid, solved afterwards, shows that extrapolation was not supported. I withdrew it. What stands is the measured drag on the finest grid.
- Cd, finest grid (6.42 M cells)
- 0.2856
- measured, inlet dynamic pressure
- Cd, experiment
- 0.3070
- AutoCFD / Loughborough
- Signed difference
- −7.0 %
- simulation minus experiment
- Numerical uncertainty
- none: no positive order on four grids
2Geometry, mesh, results
Windsor squareback body (no wheels) from the STL every v13L grid was meshed from, decimated from 2,498,748 to 149,999 triangles for display.
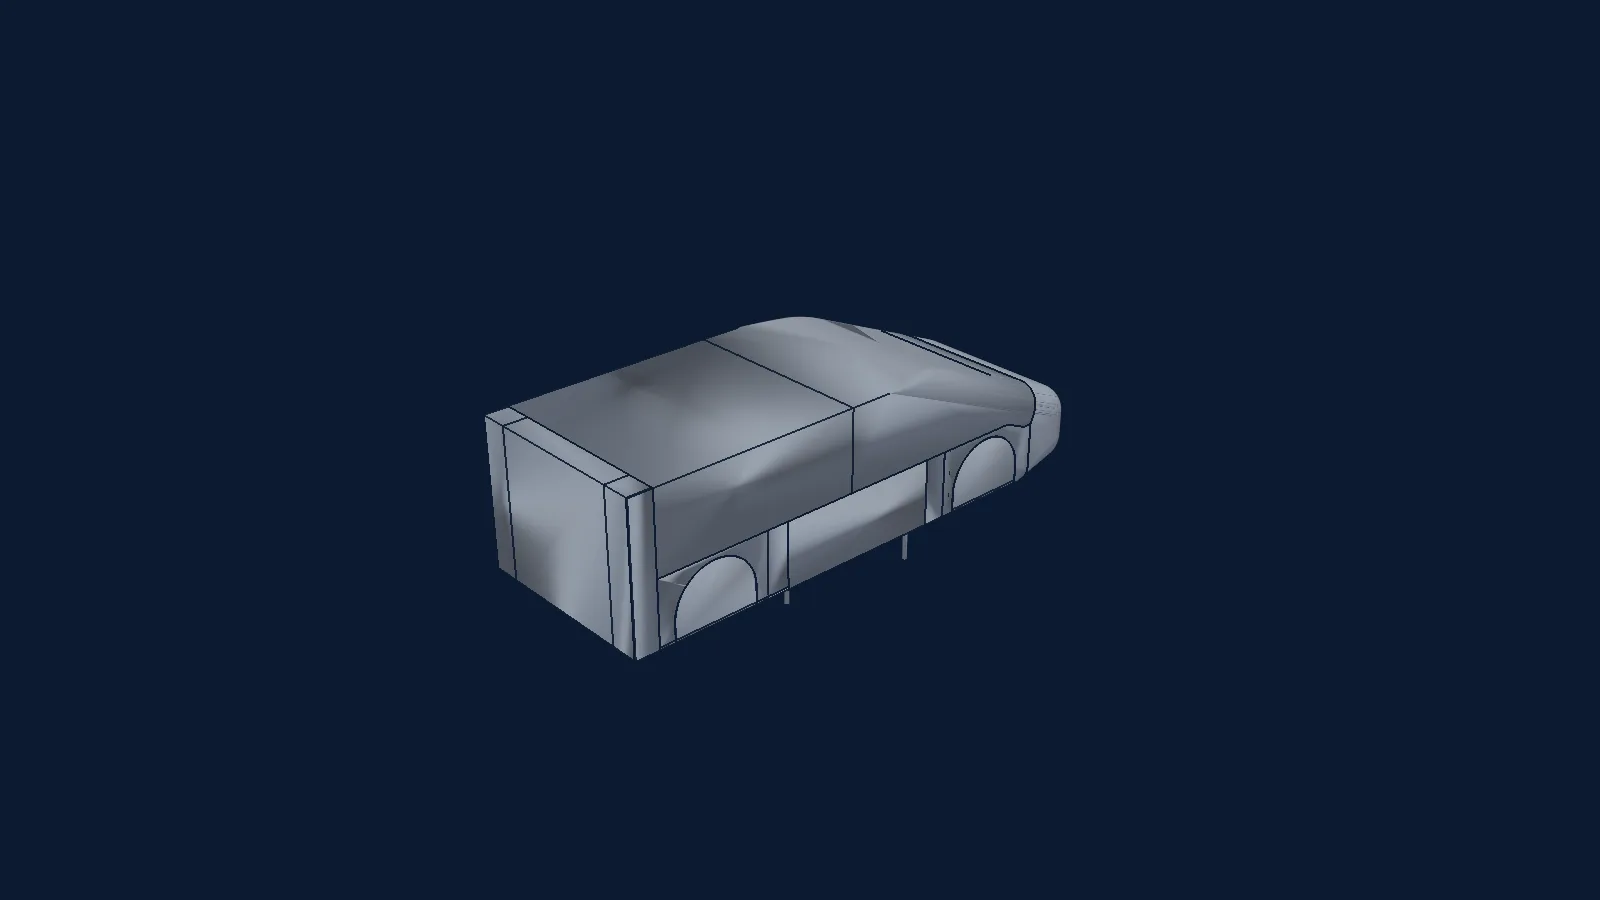
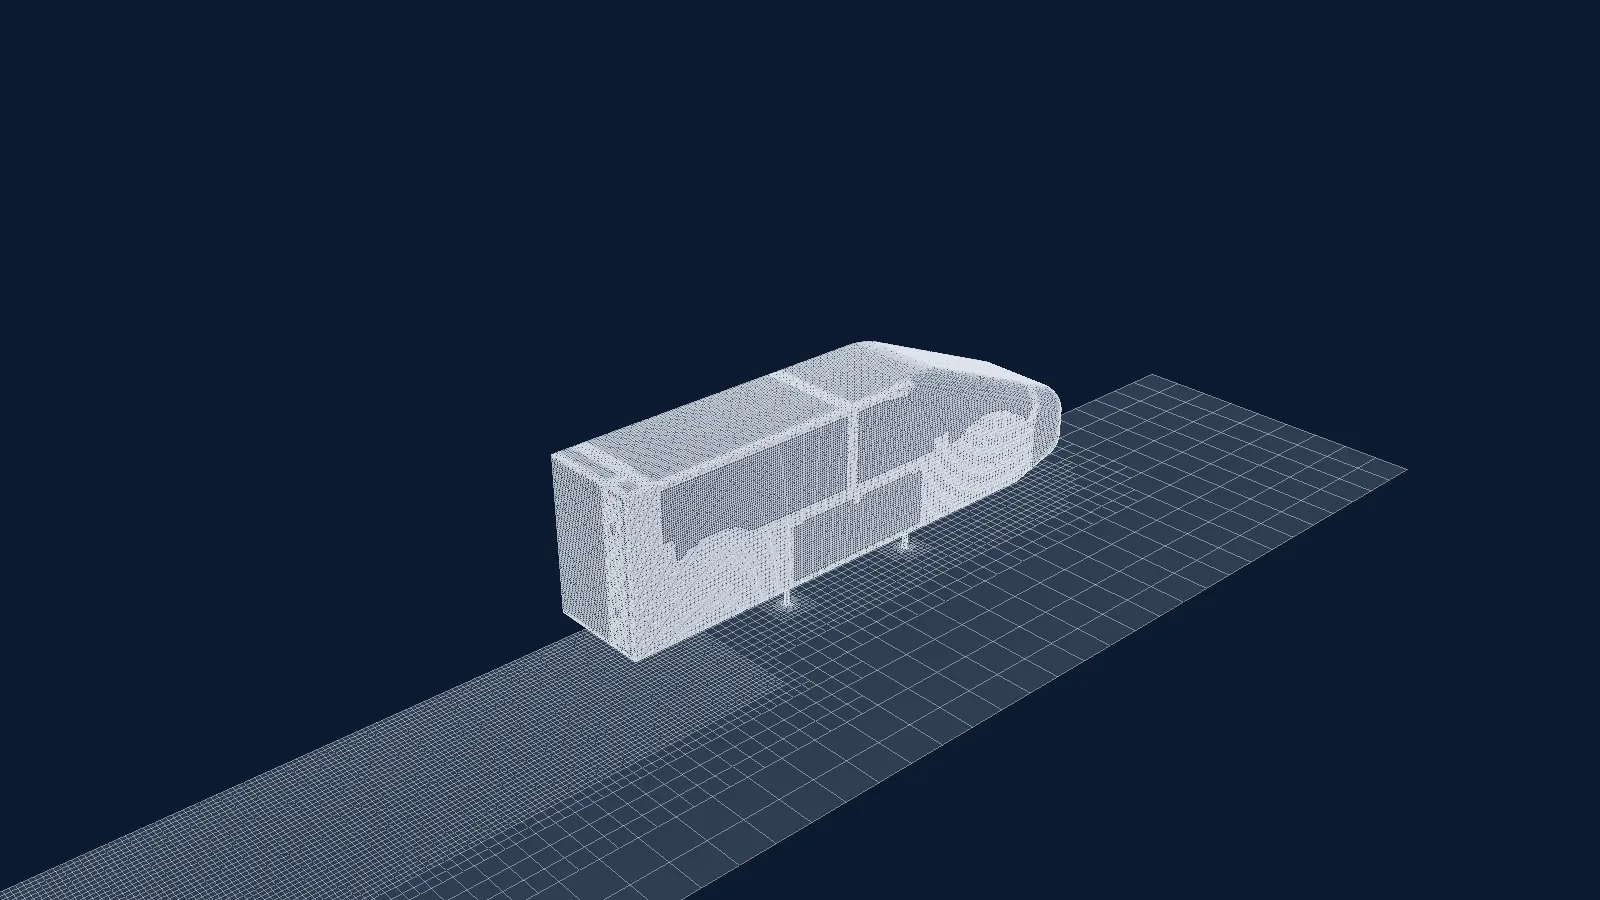
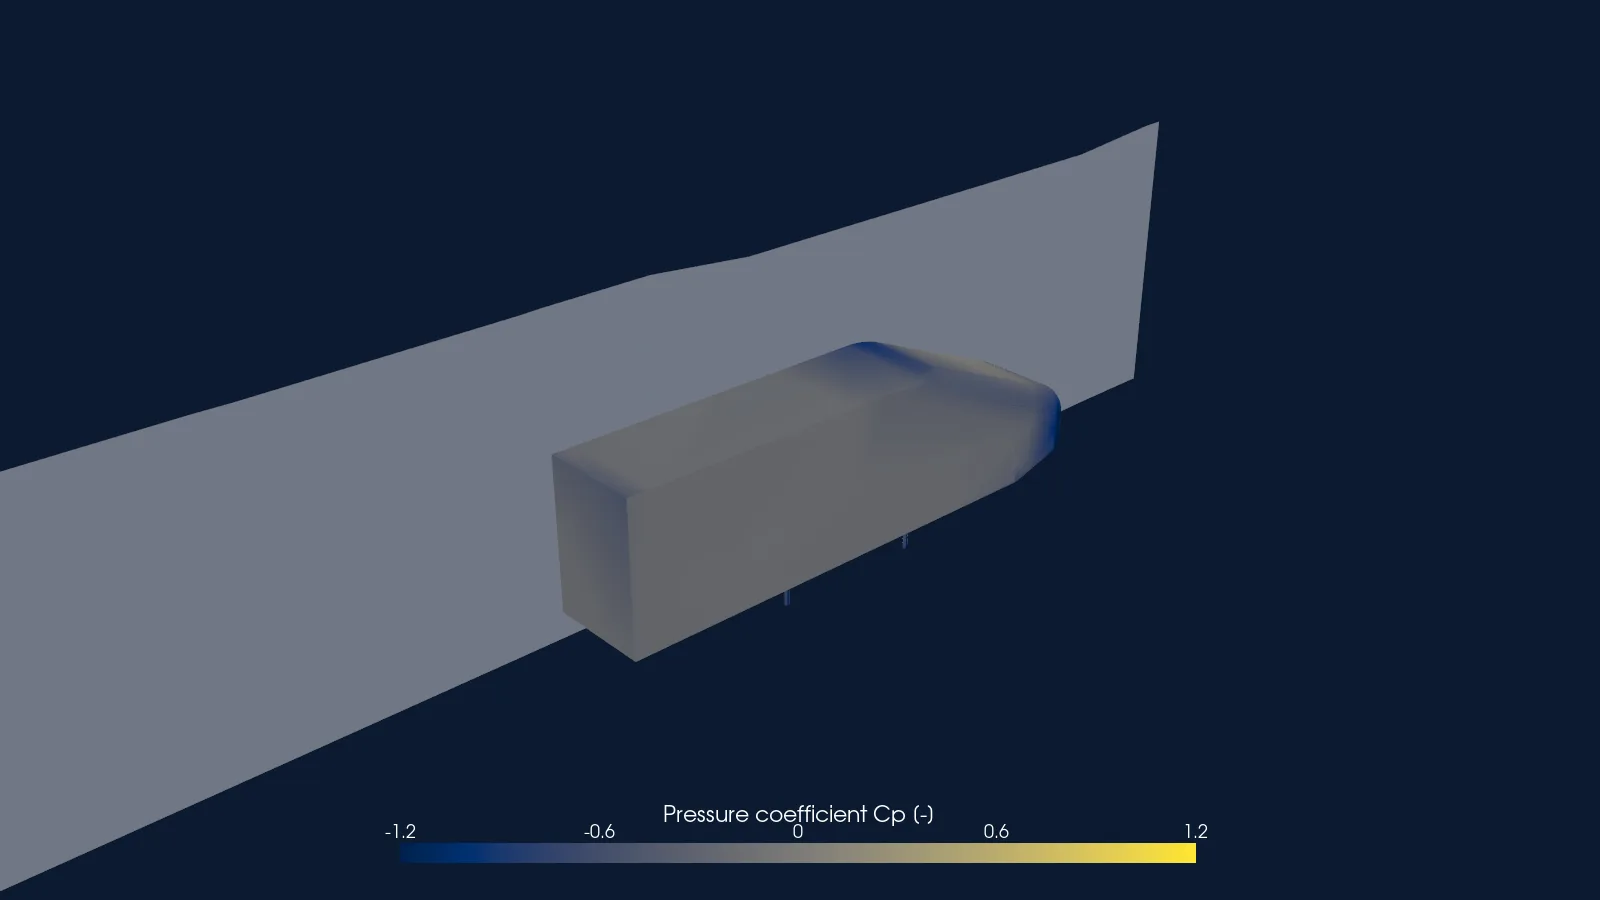
No poster exported for this step.
Drag to rotate, right-drag or two fingers to pan, wheel or pinch to zoom, click to read a value. Keys: arrows pan, W A S D rotate, + and − zoom, Enter reads the value at the centre.
3Case parameters
| Free-stream speed | 40 m/s |
|---|---|
| Reference length | 1.044 m |
| Reference area | 0.056 m² (half model) |
| Reynolds number | Not stated in the cited files |
| Fluid | Air, incompressible (Newtonian transport model) |
| Solver | OpenFOAM v2412, simpleFoam, steady |
| Turbulence model | k-omega SST |
| Wall treatment | Wall functions |
| Model | Half model on a symmetry plane, 0° yaw |
| Cells | 1.20 M, 2.06 M, 3.58 M, 6.42 M |
| Run cost | Not recorded |
4Experiment
The Windsor body is the Loughborough wind-tunnel model used by the AutoCFD workshops. The reference here is the measured drag coefficient 0.3070 at 0° yaw, with no wheels, as quoted in the campaign closure memo.
The tunnel's reference dynamic pressure is unresolved: normalised with the probe dynamic pressure instead of the inlet one, the same solves read lower, and the three-grid extrapolation moves from −9.9 % to −16.7 %. The sign of the error is robust; its size is not.
| Stated uncertainty | Not stated in the source for the drag coefficient used here. |
|---|---|
| Blockage and corrections | Reference dynamic pressure convention unresolved (inlet against probe), see above. |
| Licence | Not stated in the cited files. The public record for this model is the Loughborough University Windsor Model Experimental Aerodynamic Dataset (Varney, Pavia, Passmore and Crickmore, DOI 10.17028/rd.lboro.13161284), licensed CC BY-NC 4.0; the drag coefficient used here was taken from the closure memo and was not re-read from that record. |
Drag on four grids, with the experimental value
Experimental values (4 points)
| Cells (millions) | Experiment |
|---|---|
| 1.202 | 0.307 |
| 2.056 | 0.307 |
| 3.583 | 0.307 |
| 6.424 | 0.307 |
5Set-up
Half model on a symmetry plane at 0° yaw, steady simpleFoam with k-omega SST and wall functions. Forces are normalised with the inlet dynamic pressure at 40 m/s, reference length 1.044 m and reference area 0.056 m² (half model).
The boundary-condition files of the ladder cases are not among the files this page cites; the table is left out rather than reconstructed.
Numerics and convergence
The finest grid's force history ends at iteration 4800; the drag used is the last value written.
6Mesh
| Grid | Cells | Cd | vs experiment | Max non-orthogonality | Max skewness | checkMesh |
|---|---|---|---|---|---|---|
| Extra coarse (added later) | 1.20 M | 0.3000 | −2.3 % | 64.6 | 4.05 | “Failed 1 mesh checks.” (one skew face, waived) |
| Coarse | 2.06 M | 0.2999 | −2.3 % | 66.4 | 3.26 | “Mesh OK.” |
| Medium | 3.58 M | 0.2912 | −5.1 % | – | – | log not located |
| Fine | 6.42 M | 0.2856 | −7.0 % | 64.8 | 3.31 | “Mesh OK.” |
Mesh checks: the 2.06 M and 6.42 M grids report “Mesh OK”; I did not locate the checkMesh log for the 3.58 M grid. The 1.20 M grid reported one skewness failure (4.05), waived at the time; I disclose it here because it changes the conclusion.
7Results
Measured on the finest grid: Cd 0.2856, −7.0 % against the experiment (drag normalised with the inlet dynamic pressure). Base drag is about 92 % of the total, against 92.3 % in the experiment, so the deficit is a base-suction deficit.
Data table (4 rows)
| Cells (millions) | Simulation (simpleFoam, k-omega SST) | Experiment |
|---|---|---|
| 1.202 | 0.299975844 | 0.307 |
| 2.056 | 0.299893973 | 0.307 |
| 3.583 | 0.29123 | 0.307 |
| 6.424 | 0.285559005 | 0.307 |
| Quantity | Experiment | Simulation | Signed difference |
|---|---|---|---|
| Drag coefficient Cd, finest grid | 0.3070 | 0.2856 | −7.0 % |
| Lift coefficient Cl, finest grid | −0.030 | −0.142 | sign-magnitude failure |
| Drag, three-grid extrapolation (withdrawn) | 0.3070 | 0.2765 | −9.9 % |
Lift is far off: −0.142 against −0.030. The closure memo calls it a sign-magnitude failure and leaves it unresolved.
8Numerical accuracy
The three original grids (2.06 M, 3.58 M, 6.42 M) gave an apparent order of 2.50, a Richardson value of 0.2765 and a GCI of 9.5 %. Those numbers came with warnings from the tool itself: the order was above the formal 2 and outside the reliable band, the refinement ratios (1.215 and 1.203) were below the 1.3 that Celik et al. call desirable, and three grids give no way to check the order. Adding the 1.20 M grid tests it.
Successive Cd differences, coarse to fine: 0.0001, 0.0087, 0.0057. They do not shrink steadily with refinement, so no single-order error model fits.
The four-grid least-squares fit (Eça and Hoekstra) finds no positive order and an uncertainty of 74 % of the value. There is nothing to extrapolate, so the earlier Richardson value −9.9 % and its band [−18.8 %, −1.1 %] are withdrawn.
Output of the shared GCI tool, unedited
Three grids (2.06 M, 3.58 M, 6.42 M)
GCI      N=(2055828,3583221,6424474)  r21=1.2148 r32=1.2035  (unequal-ratio form: YES)
         f: coarse=0.299894 medium=0.291230 fine=0.285559
         observed order p = 2.498   (formal 2.0)
         Richardson f(h->0) = 0.276500
         GCI_fine = 9.517 %   (Fs=3.00 auto; approx. rel. err fine-vs-medium = 1.986 %)
         asymptotic check = 0.981  (want ~1.0)
         WARNING: p=2.498 EXCEEDS the formal order 2.0 by >15% -- NOT in the asymptotic range, or the ratios/QoI are wrong. This is a warning, not a bonus.
         WARNING: p=2.498 is OUTSIDE Eca & Hoekstra's reliable band [0.5, 2.14) -- Fs escalated 1.25 -> 3.0. The GCI above is 2.4x what a naive Fs=1.25 would report; that is the honest number.
         WARNING: 3-grid family: p has NO redundancy and is unverifiable. Quote p ~ 2.5 (+-0.1 under force-tail noise), not to 3 s.f. Use >=4 grids (gci_multi.py) for a checkable order.
Four grids, least squares
LSR      Eca & Hoekstra 2014 least-squares, ng=4  (h sorted finest->coarsest: 1.0000, 1.2148, 1.4620, 1.7486)
         f: 0.285559, 0.291230, 0.299894, 0.299976
         delta_RE unweighted p =  -2.1103   sigma = 0.002894
         delta_RE eq16       p =  -1.8100   sigma = 0.002783
         observed order p = n/a   (formal 2.0)   verdict: anomalous (p <= 0 in both delta_RE fits)
         chosen fit: 1&2 combined (eq16)   phi0 = 0.215364   alpha = 0.0978112   alpha2 = -0.0280891
         sigma = 0.002261   Delta_phi = 0.004806   F_sigma = 0.470  (want < 1)
         U_phi(finest) = 0.211899  (74.205 % of f_fine; eq (20); Fs=3.00; eps=0.06972, sigma=0.002261, |f-fit|=0.0004725)
         WARNING: Fs escalated to 3 (no p > 0) -- Sec. 3 p.108.
         WARNING: delta_RE NOT used: p impossible to establish (both delta_RE fits p <= 0): 6 fixed-exponent fits (App. A bullet 3). Chosen '1&2 combined' (eq16) on smallest sigma.
From data/windsor-nw-ladder.json (gci_3grid), data/windsor-nw-ladder.json (gci_4grid_lsr), written by pipeline/build_assets.py.
9Why they differ, and what I distrust
Limits, as recorded in the ledger. A fourth, coarser grid (1.2M cells, Cd 0.29998, solved after the write-up) breaks the convergence pattern (successive Cd differences 0.0001, 0.0087, 0.0057 do not shrink steadily): the 4-grid least-squares fit has no positive order, so the earlier Richardson value -9.9 % and its band [-18.8 %, -1.1 %] are withdrawn. The tunnel's reference dynamic pressure is unresolved: probe-normalised the same solves read about 2.5 % lower (3-grid extrapolations -9.9 % inlet vs -16.7 % probe). Lift is far off: -0.142 against -0.030 (the closure memo calls it a sign-magnitude failure and leaves it unresolved). The 1.2M grid had one skewness failure waived. Earlier -0.7 % and -5.1 % figures are superseded.
With wheels and yaw. Three grids with observed order 5-7, noise-limited (the medium-to-fine step equals the limit-cycle amplitude); no checkMesh log exists for the 5.59M grid. Yaw cases are single full-model grids; 0 deg is a half model. Wheels static, contact patch bridged, probe-q would read about -14.5 %. Lift sign flip is reproduced. Single experiment, so a comparison, not a validation.
- The 1.20 M grid had one skewness failure, waived; the 3.58 M grid has no checkMesh log I could locate.
- Earlier single-grid figures for this case are superseded by the ladder and are not shown.
10References
- AutoCFD workshops, Windsor squareback body (Loughborough University wind-tunnel model): experimental force coefficients, as quoted in the campaign closure memo of 2026-07-30.
- Pavia et al. (2018, 2020): wake bi-stability on this model, cited in the closure memo for the base-pressure shape.
- Celik et al. (2008), the ASME Journal of Fluids Engineering procedure for discretisation error; its refinement-ratio guidance is quoted in the ladder memo.
- Eça and Hoekstra (2014), least-squares procedure for numerical uncertainty, as implemented in the shared GCI tool.
Source files
D:/CFD/verif/v13-windsor-build/WINDSOR-CLOSURE-2026-07-30.mdD:/CFD/verif/v13-windsor-build/LADDER-GCI-2026-07-30.txtD:/cfd-runs/v13L-xcoarse/postProcessing/forceCoeffs/0/coefficient.datD:/cfd-runs/v13L-coarse-results/postProcessing/forceCoeffs/0/coefficient.datD:/cfd-runs/v13L-fine-results/postProcessing/forceCoeffs/0/coefficient.datD:/cfd-runs/v13L-*/log.checkMeshD:/CFD/AUDIT-2026-07-29-PLAN-AND-METHOD.mdsite/public/data/windsor-nw-ladder.json (GCI tool output, built by pipeline/build_assets.py)
Last updated 2026-11-14. One-page summary (prints to one A4 page), also as a PDF. Every number on this page is checked against its source file by pipeline/check_numbers.py.