Tandem Ahmed bodies: steady RANS follows the drag trend, not the close-gap values
I computed one 75 %-scale Ahmed body with a 25° slant as the reference, then two bodies in line at eight gaps, and compared the drag ratios with a wind-tunnel thesis. The isolated drag is 6 to 7 % below experiment on one mesh. The trend with gap is reproduced; the lead body is 12 to 28 % low at close gaps, and the one grid study did not converge.
- Isolated Cd, simulation
- 0.2798
- k-omega SST, one mesh of 651,166 cells
- Isolated Cd, experiment
- 0.30
- Pagliarella 2009, Table 4.1, same Reynolds number; Meile 2011 (full scale): 0.299
- Signed difference
- −6.7 %
- simulation minus experiment; −6.4 % against Meile
- Numerical uncertainty
- none: single grid
- the only ladder (tandem, x/L 0.5) did not converge
2Geometry, mesh, results
75 %-scale Ahmed body (25 deg slant) above a fixed no-slip floor in a tunnel-sized domain; body feature edges, floor outline and domain box.
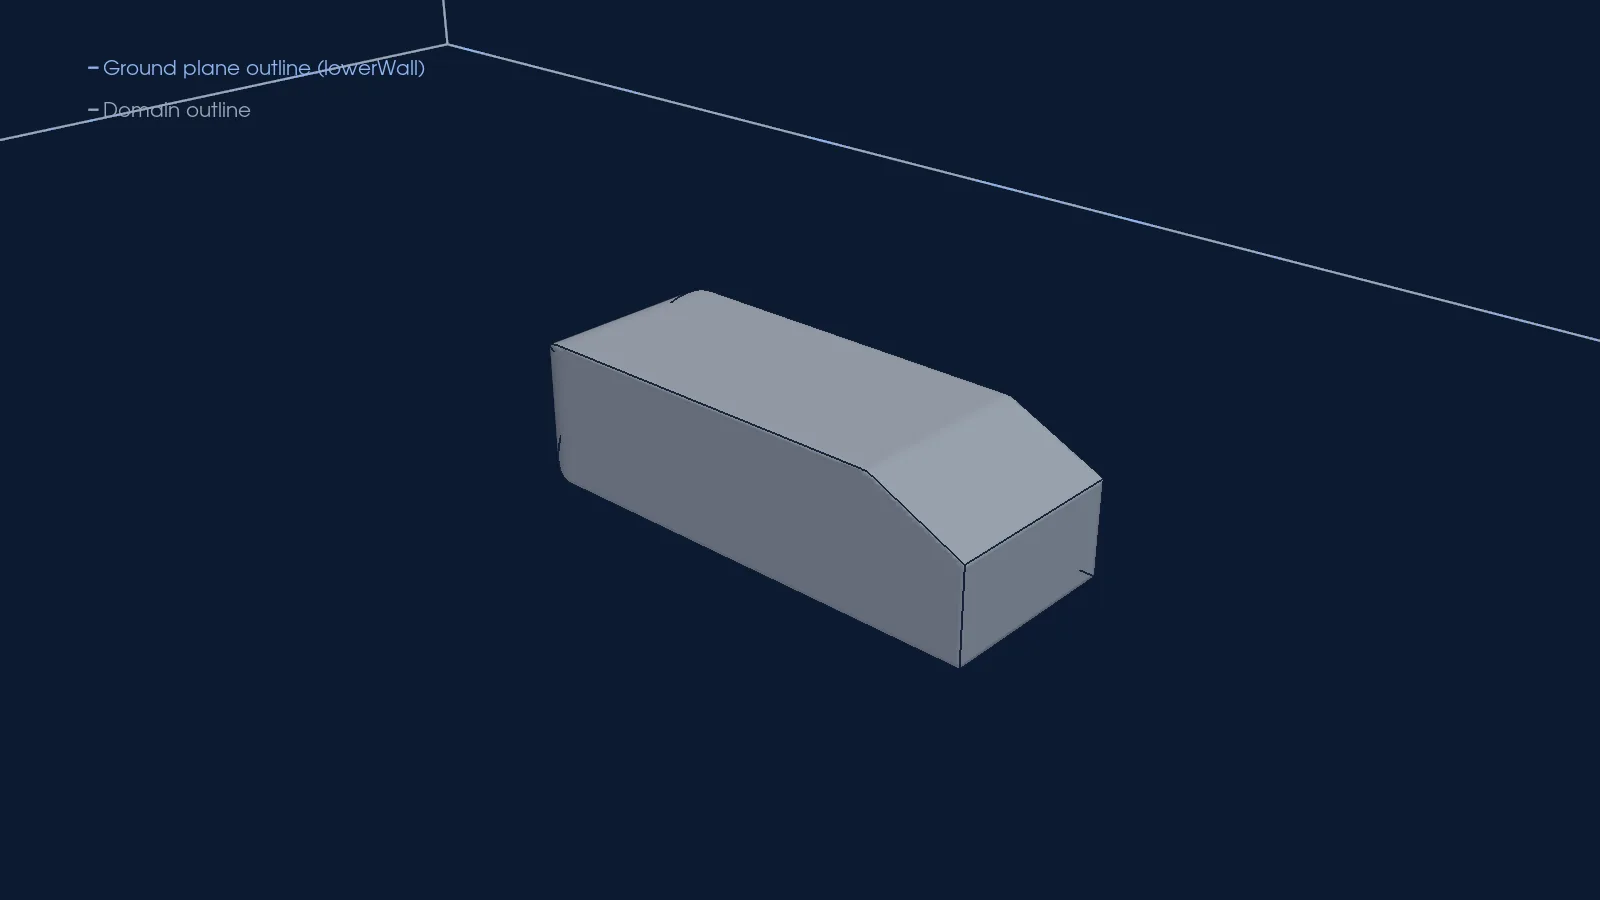
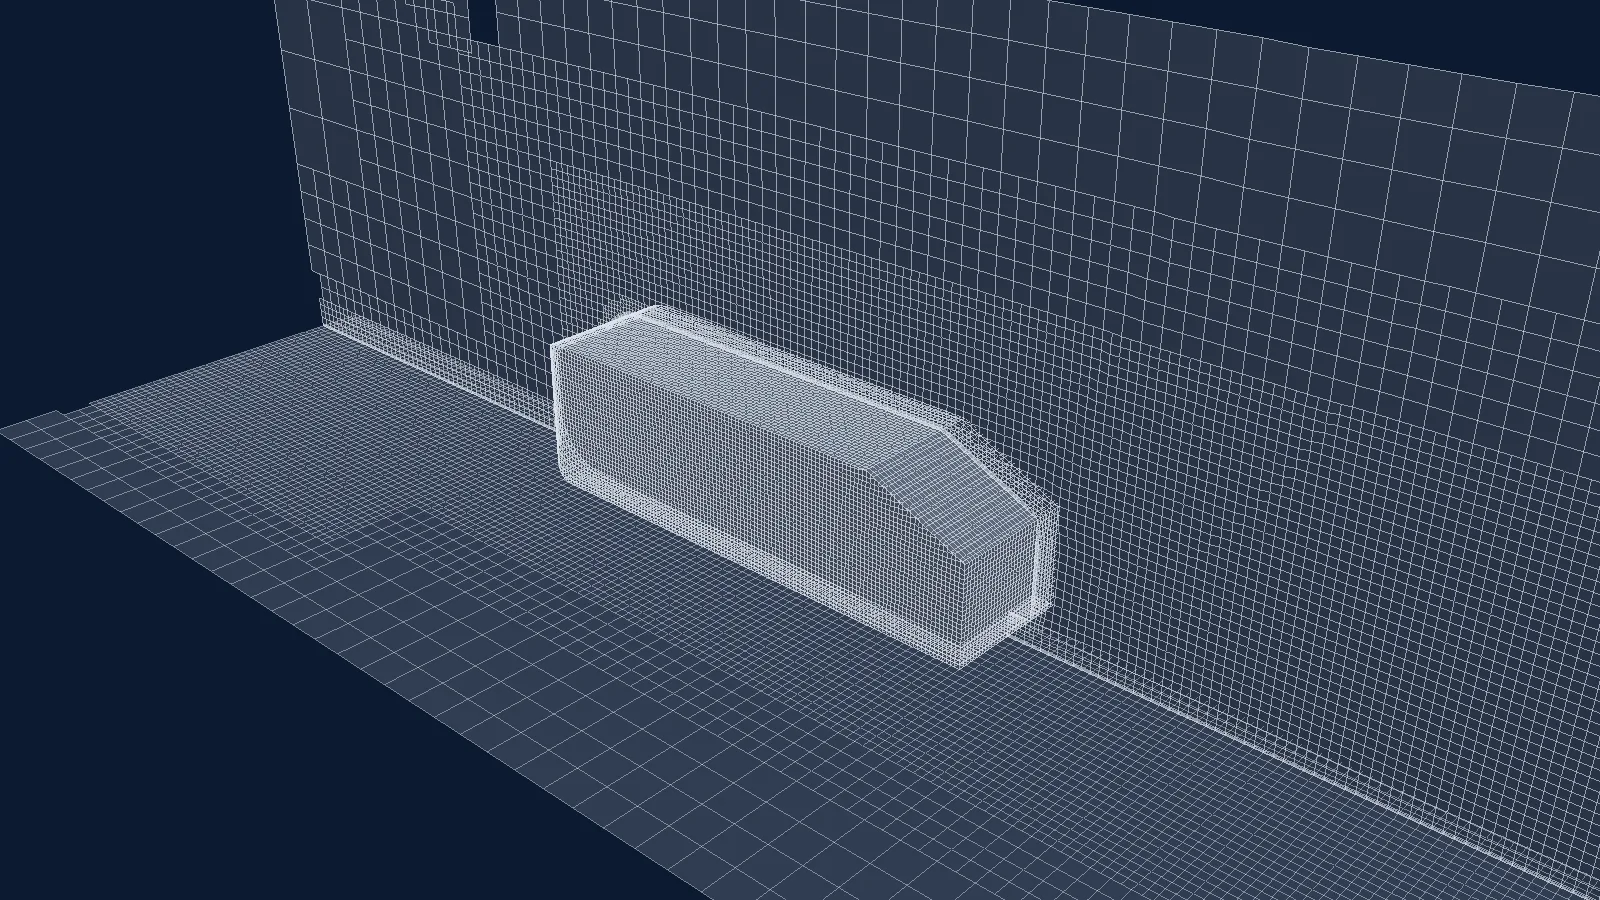
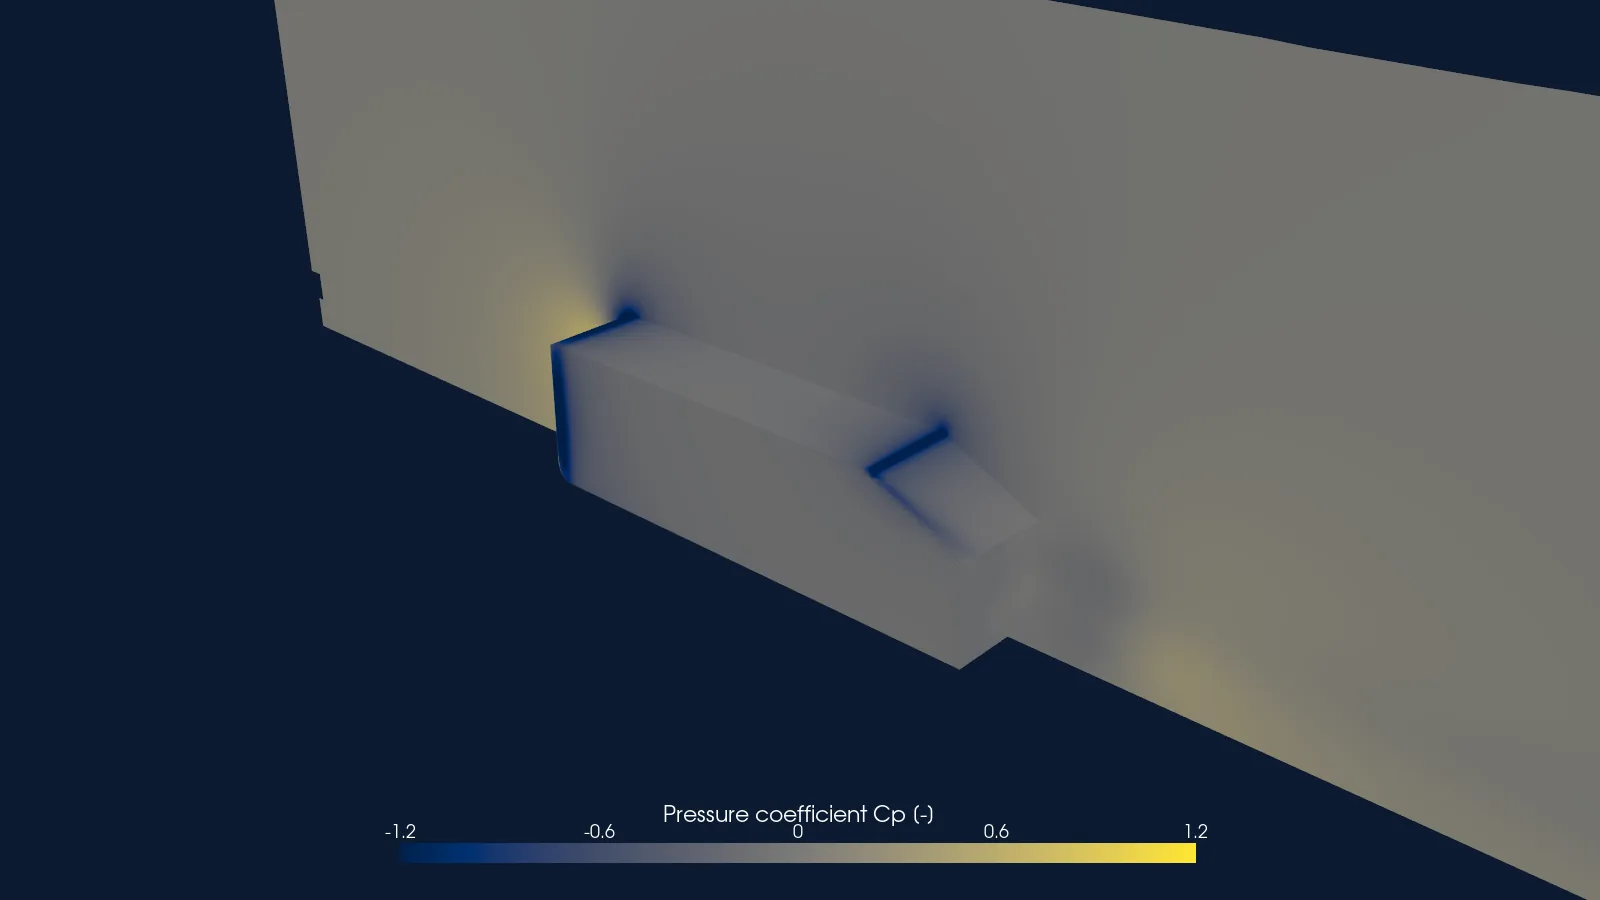
No poster exported for this step.
Drag to rotate, right-drag or two fingers to pan, wheel or pinch to zoom, click to read a value. Keys: arrows pan, W A S D rotate, + and − zoom, Enter reads the value at the centre.
3Case parameters
| Reynolds number (free-stream speed, body length) | 1.8 × 10⁶ |
|---|---|
| Free-stream speed | 34.48276 m/s |
| Body length (75 % of the Ahmed body) | 0.783 m |
| Reference area (frontal) | 0.063018 m² |
| Ground clearance | 37.5 mm |
| Fluid | Incompressible air, kinematic viscosity 1.5e-05 m²/s (assumed air at about 20 °C) |
| Solver | OpenFOAM v2412, simpleFoam (steady, SIMPLEC) |
| Turbulence model | k-omega SST |
| Wall treatment | Wall functions (nutkWallFunction) on body and floor; body y+ min 3.76, mean 33.6, max 328 |
| Cells | 651,166 (isolated body); 959,726 to 1,117,992 per tandem gap |
| Run cost (isolated body) | 1500 iterations on 4 MPI ranks, 4698 s wall clock |
4Experiment
Two experiments are used. The like-for-like one is Pagliarella's RMIT thesis (2009): 75 %-scale Ahmed bodies at the same Reynolds number as my case (1.8 × 10⁶), in a closed-jet tunnel of 3 m × 2 m with a fixed floor and 1.8 % turbulence intensity. His isolated 25° body gives Cd 0.30 (Table 4.1, two significant figures). For the tandem pairs he gives drag ratios C_D / C_D,isolated against the gap x/L from the lead-body base, in Fig. 4.1a, measured with an internal balance on one body at a time.
The second is Meile et al. (2011): a full-scale Ahmed body (frontal area 0.112 m²) in a 3/4-open jet at 40 m/s, Reynolds number 2.78 × 10⁶, Cd 0.299 and Cl 0.345. I show it because it is a common reference, but it is a weak comparator here: different scale, a Reynolds number about one and a half times mine, and an open jet. Their own data show Cd changing with Reynolds number over this range by an amount comparable to my gap.
I digitised the tandem ratios and their error-bar ends from the vector drawing of Fig. 4.1a; they are not tabulated in the thesis. I spot-checked eight points against the figure by eye. The figure itself is not reproduced here.
| Stated uncertainty | Not stated in either source for the isolated-body Cd (Pagliarella gives two significant figures, Meile none). The tandem error bars are, according to my reading notes on the thesis (p67, not re-checked for this page), propagated instrument errors only (balance accuracy 0.1 N, barometer, temperature, dynamic pressure), with no repeat-run scatter. The precision of my digitising is not quantified. |
|---|---|
| Blockage and corrections | Pagliarella: blockage below 2 %, uncorrected; fixed floor with a boundary-layer displacement thickness of 7.6 to 12.8 mm (reading notes). Meile: blockage 3.8 %, not corrected. My domain has a blockage of 1.05 % per body and free-slip side and roof walls. |
| Licence | The RMIT repository record of the thesis (DOI 10.25439/rmt.27587067) is marked all rights reserved; Meile et al. 2011 (CFD Letters) has no licence stated locally. Only numerical values are quoted here, with citation; no figure is reproduced. The digitised tandem series is attributed to Pagliarella (2009), Fig. 4.1a. |
Lead-body drag ratio against gap (Pagliarella 2009, Fig. 4.1a, digitised), with the simulation
Experimental values (8 points)
| Gap x/L from the lead-body base | Experiment (Pagliarella 2009, Fig. 4.1a, digitised) |
|---|---|
| 0.125 | 0.4052 |
| 0.25 | 0.3612 |
| 0.375 | 0.4695 |
| 0.5 | 0.6285 |
| 0.75 | 0.767 |
| 1 | 0.8481 |
| 1.5 | 0.9462 |
| 2 | 1.024 |
Trail-body drag ratio against gap (Pagliarella 2009, Fig. 4.1a, digitised), with the simulation
Experimental values (8 points)
| Gap x/L from the lead-body base | Experiment (Pagliarella 2009, Fig. 4.1a, digitised) |
|---|---|
| 0.125 | 1.303 |
| 0.25 | 1.3855 |
| 0.375 | 1.3431 |
| 0.5 | 1.1933 |
| 0.75 | 1.039 |
| 1 | 0.9859 |
| 1.5 | 0.9571 |
| 2 | 0.9522 |
5Set-up
A box the size of the RMIT tunnel cross-section (x −2.4 to 7.2 m, y ±1.5 m, z 0 to 2 m), body nose at x = 0. The floor is a no-slip wall with wall functions; the side walls and the roof are free-slip, so there is no tunnel-wall boundary layer. The body is the clean Ahmed shape scaled to 75 %: no support stings and no mounting plate, which the experiment had.
The isolated body has two jobs: it is a single-body comparison in its own right, and its Cd (0.2798) is the denominator of every tandem ratio. The tandem cases repeat the same recipe with two bodies, one mesh per gap, at eight gaps from x/L 0.125 to 2.0.
Inflow turbulence matches the tunnel's 1.8 % intensity. The floor boundary layer is thinner than the tunnel's: about 5 to 6 mm at the nose, against 7.6 to 12.8 mm in the thesis.
| Boundary | Type | Value |
|---|---|---|
| Inlet | fixed velocity; zero-gradient pressure; fixed k and omega | (34.48276 0 0) m/s; k 0.57788 m²/s², omega 1.75462 1/s |
| Outlet | fixed pressure; inletOutlet for U, k, omega | p 0 (kinematic) |
| Floor (lowerWall) | no-slip wall; nutkWallFunction, kqRWallFunction, omegaWallFunction | |
| Body (lead_body) | no-slip wall; nutkWallFunction, kqRWallFunction, omegaWallFunction | |
| Roof (upperWall) | slip | |
| Side walls (frontAndBack) | slip |
Numerics and convergence
Steady simpleFoam, SIMPLEC (consistent) with two non-orthogonal correctors. Convection: bounded linearUpwindV for U, bounded first-order upwind for k and omega. A fixed 1500 iterations with no residual control; values are late-window means of Cd, not the last iteration.
Isolated body: Cd reads 0.2798156 at iterations 500, 1000 and 1500, so it is iteratively converged. Raising the free-stream omega thirty-fold changed it to 0.27796 (−0.67 %).
Tandem gaps: the force histories oscillate, most strongly at the two closest gaps, so a steady solver returns an iteration mean of an unsteady-looking history, not a time mean. Ratios are means over iterations 751 to 1500, except x/L 0.375, which changed regime near iteration 1100 and is averaged over iterations 1501 to 2500. The bars on the simulation are iterative scatter: the larger of the window drift and the standard deviation, divided by the isolated Cd.
Data tables, one per series (301 points)
| Iteration | Isolated body, Cd per iteration (single25, lead body) |
|---|---|
| 1 | 0.7952361 |
| 6 | 0.3950386 |
| 11 | 0.3056179 |
| 16 | 0.2751546 |
| 21 | 0.2746526 |
| 26 | 0.2830924 |
| 31 | 0.2862091 |
| 36 | 0.2872737 |
| 41 | 0.2892256 |
| 46 | 0.2882405 |
| 51 | 0.2844736 |
| 56 | 0.2825885 |
| 61 | 0.2824546 |
| 66 | 0.285604 |
| 71 | 0.2886066 |
| 76 | 0.2891382 |
| 81 | 0.285035 |
| 86 | 0.2750371 |
| 91 | 0.2755288 |
| 96 | 0.2793331 |
| 101 | 0.2797012 |
| 106 | 0.2798878 |
| 111 | 0.2802101 |
| 116 | 0.2794643 |
| 121 | 0.2792676 |
| 126 | 0.2792302 |
| 131 | 0.2791209 |
| 136 | 0.2793505 |
| 141 | 0.279366 |
| 146 | 0.2792551 |
| 151 | 0.2793933 |
| 156 | 0.2794226 |
| 161 | 0.2794582 |
| 166 | 0.2796092 |
| 171 | 0.2796086 |
| 176 | 0.2796691 |
| 181 | 0.2797218 |
| 186 | 0.2797 |
| 191 | 0.2798003 |
| 196 | 0.2798786 |
| 201 | 0.2798725 |
| 206 | 0.2799152 |
| 211 | 0.2799033 |
| 216 | 0.2798664 |
| 221 | 0.2798751 |
| 226 | 0.2798442 |
| 231 | 0.2798196 |
| 236 | 0.2798225 |
| 241 | 0.2797982 |
| 246 | 0.2797923 |
| 251 | 0.2797994 |
| 256 | 0.2797885 |
| 261 | 0.2797963 |
| 266 | 0.2798048 |
| 271 | 0.2798017 |
| 276 | 0.2798124 |
| 281 | 0.2798171 |
| 286 | 0.2798154 |
| 291 | 0.2798228 |
| 296 | 0.2798222 |
| 301 | 0.27982 |
| 306 | 0.2798232 |
| 311 | 0.2798199 |
| 316 | 0.2798179 |
| 321 | 0.2798192 |
| 326 | 0.2798156 |
| 331 | 0.2798151 |
| 336 | 0.2798159 |
| 341 | 0.2798134 |
| 346 | 0.2798141 |
| 351 | 0.2798149 |
| 356 | 0.2798135 |
| 361 | 0.2798149 |
| 366 | 0.2798153 |
| 371 | 0.2798147 |
| 376 | 0.2798159 |
| 381 | 0.2798159 |
| 386 | 0.2798155 |
| 391 | 0.2798163 |
| 396 | 0.2798159 |
| 401 | 0.2798157 |
| 406 | 0.2798161 |
| 411 | 0.2798157 |
| 416 | 0.2798155 |
| 421 | 0.279816 |
| 426 | 0.2798155 |
| 431 | 0.2798154 |
| 436 | 0.2798157 |
| 441 | 0.2798156 |
| 446 | 0.2798154 |
| 451 | 0.2798155 |
| 456 | 0.2798156 |
| 461 | 0.2798156 |
| 466 | 0.2798154 |
| 471 | 0.2798155 |
| 476 | 0.2798156 |
| 481 | 0.2798156 |
| 486 | 0.2798155 |
| 491 | 0.2798156 |
| 496 | 0.2798156 |
| 501 | 0.2798156 |
| 506 | 0.2798155 |
| 511 | 0.2798156 |
| 516 | 0.2798156 |
| 521 | 0.2798156 |
| 526 | 0.2798156 |
| 531 | 0.2798156 |
| 536 | 0.2798156 |
| 541 | 0.2798156 |
| 546 | 0.2798156 |
| 551 | 0.2798156 |
| 556 | 0.2798156 |
| 561 | 0.2798156 |
| 566 | 0.2798156 |
| 571 | 0.2798156 |
| 576 | 0.2798156 |
| 581 | 0.2798156 |
| 586 | 0.2798156 |
| 591 | 0.2798156 |
| 596 | 0.2798156 |
| 601 | 0.2798156 |
| 606 | 0.2798156 |
| 611 | 0.2798156 |
| 616 | 0.2798156 |
| 621 | 0.2798156 |
| 626 | 0.2798156 |
| 631 | 0.2798156 |
| 636 | 0.2798156 |
| 641 | 0.2798156 |
| 646 | 0.2798156 |
| 651 | 0.2798156 |
| 656 | 0.2798156 |
| 661 | 0.2798156 |
| 666 | 0.2798156 |
| 671 | 0.2798156 |
| 676 | 0.2798156 |
| 681 | 0.2798156 |
| 686 | 0.2798156 |
| 691 | 0.2798156 |
| 696 | 0.2798156 |
| 701 | 0.2798156 |
| 706 | 0.2798156 |
| 711 | 0.2798156 |
| 716 | 0.2798156 |
| 721 | 0.2798156 |
| 726 | 0.2798156 |
| 731 | 0.2798156 |
| 736 | 0.2798156 |
| 741 | 0.2798156 |
| 746 | 0.2798156 |
| 751 | 0.2798156 |
| 756 | 0.2798156 |
| 761 | 0.2798156 |
| 766 | 0.2798156 |
| 771 | 0.2798156 |
| 776 | 0.2798156 |
| 781 | 0.2798156 |
| 786 | 0.2798156 |
| 791 | 0.2798156 |
| 796 | 0.2798156 |
| 801 | 0.2798156 |
| 806 | 0.2798156 |
| 811 | 0.2798156 |
| 816 | 0.2798156 |
| 821 | 0.2798156 |
| 826 | 0.2798156 |
| 831 | 0.2798156 |
| 836 | 0.2798156 |
| 841 | 0.2798156 |
| 846 | 0.2798156 |
| 851 | 0.2798156 |
| 856 | 0.2798156 |
| 861 | 0.2798156 |
| 866 | 0.2798156 |
| 871 | 0.2798156 |
| 876 | 0.2798156 |
| 881 | 0.2798156 |
| 886 | 0.2798156 |
| 891 | 0.2798156 |
| 896 | 0.2798156 |
| 901 | 0.2798156 |
| 906 | 0.2798156 |
| 911 | 0.2798156 |
| 916 | 0.2798156 |
| 921 | 0.2798156 |
| 926 | 0.2798156 |
| 931 | 0.2798156 |
| 936 | 0.2798156 |
| 941 | 0.2798156 |
| 946 | 0.2798156 |
| 951 | 0.2798156 |
| 956 | 0.2798156 |
| 961 | 0.2798156 |
| 966 | 0.2798156 |
| 971 | 0.2798156 |
| 976 | 0.2798156 |
| 981 | 0.2798156 |
| 986 | 0.2798156 |
| 991 | 0.2798156 |
| 996 | 0.2798156 |
| 1001 | 0.2798156 |
| 1006 | 0.2798156 |
| 1011 | 0.2798156 |
| 1016 | 0.2798156 |
| 1021 | 0.2798156 |
| 1026 | 0.2798156 |
| 1031 | 0.2798156 |
| 1036 | 0.2798156 |
| 1041 | 0.2798156 |
| 1046 | 0.2798156 |
| 1051 | 0.2798156 |
| 1056 | 0.2798156 |
| 1061 | 0.2798156 |
| 1066 | 0.2798156 |
| 1071 | 0.2798156 |
| 1076 | 0.2798156 |
| 1081 | 0.2798156 |
| 1086 | 0.2798156 |
| 1091 | 0.2798156 |
| 1096 | 0.2798156 |
| 1101 | 0.2798156 |
| 1106 | 0.2798156 |
| 1111 | 0.2798156 |
| 1116 | 0.2798156 |
| 1121 | 0.2798156 |
| 1126 | 0.2798156 |
| 1131 | 0.2798156 |
| 1136 | 0.2798156 |
| 1141 | 0.2798156 |
| 1146 | 0.2798156 |
| 1151 | 0.2798156 |
| 1156 | 0.2798156 |
| 1161 | 0.2798156 |
| 1166 | 0.2798156 |
| 1171 | 0.2798156 |
| 1176 | 0.2798156 |
| 1181 | 0.2798156 |
| 1186 | 0.2798156 |
| 1191 | 0.2798156 |
| 1196 | 0.2798156 |
| 1201 | 0.2798156 |
| 1206 | 0.2798156 |
| 1211 | 0.2798156 |
| 1216 | 0.2798156 |
| 1221 | 0.2798156 |
| 1226 | 0.2798156 |
| 1231 | 0.2798156 |
| 1236 | 0.2798156 |
| 1241 | 0.2798156 |
| 1246 | 0.2798156 |
| 1251 | 0.2798156 |
| 1256 | 0.2798156 |
| 1261 | 0.2798156 |
| 1266 | 0.2798156 |
| 1271 | 0.2798156 |
| 1276 | 0.2798156 |
| 1281 | 0.2798156 |
| 1286 | 0.2798156 |
| 1291 | 0.2798156 |
| 1296 | 0.2798156 |
| 1301 | 0.2798156 |
| 1306 | 0.2798156 |
| 1311 | 0.2798156 |
| 1316 | 0.2798156 |
| 1321 | 0.2798156 |
| 1326 | 0.2798156 |
| 1331 | 0.2798156 |
| 1336 | 0.2798156 |
| 1341 | 0.2798156 |
| 1346 | 0.2798156 |
| 1351 | 0.2798156 |
| 1356 | 0.2798156 |
| 1361 | 0.2798156 |
| 1366 | 0.2798156 |
| 1371 | 0.2798156 |
| 1376 | 0.2798156 |
| 1381 | 0.2798156 |
| 1386 | 0.2798156 |
| 1391 | 0.2798156 |
| 1396 | 0.2798156 |
| 1401 | 0.2798156 |
| 1406 | 0.2798156 |
| 1411 | 0.2798156 |
| 1416 | 0.2798156 |
| 1421 | 0.2798156 |
| 1426 | 0.2798156 |
| 1431 | 0.2798156 |
| 1436 | 0.2798156 |
| 1441 | 0.2798156 |
| 1446 | 0.2798156 |
| 1451 | 0.2798156 |
| 1456 | 0.2798156 |
| 1461 | 0.2798156 |
| 1466 | 0.2798156 |
| 1471 | 0.2798156 |
| 1476 | 0.2798156 |
| 1481 | 0.2798156 |
| 1486 | 0.2798156 |
| 1491 | 0.2798156 |
| 1496 | 0.2798156 |
| 1500 | 0.2798156 |
6Mesh
| Cells (isolated body) | 651,166 |
|---|---|
| Cell types | 620,130 hexahedra, 1,288 prisms, 29,748 polyhedra |
| Prism layers on the body | 5.06 of 6 achieved on average |
| Body y+ (wall functions) | min 3.76, mean 33.6, max 328 |
| Floor y+ | min 33.0, mean 90.4, max 451 |
| Max non-orthogonality | 55.07 |
| Max skewness | 2.755 |
| Max aspect ratio | 21.0 |
| checkMesh, standard | “Mesh OK.” |
| checkMesh, extended (-allGeometry -allTopology) | “Failed 3 mesh checks.”: 2 cells with determinant below 0.001, 2 faces with interpolation weight below 0.05, 26,124 concave cells |
| Grid | Cells | Averaging window (iterations) | Lead ratio | Trail ratio |
|---|---|---|---|---|
| n1 | 190,805 | 751 to 1500 | 0.671 ± 0.053 | 1.337 ± 0.058 |
| n2 | 1,007,017 | 751 to 1500 | 0.526 ± 0.047 | 1.298 ± 0.034 |
| n3 | 3,121,871 | 1251 to 2500 | 0.706 ± 0.040 | 1.266 ± 0.041 |
| n4 | 6,957,375 | 1251 to 2500 | 0.360 ± 0.026 | 1.470 ± 0.034 |
| Experiment (Pagliarella 2009) | – | – | 0.628 (0.596 to 0.664) | 1.193 (1.125 to 1.269) |
The isolated-body mesh passes the standard checkMesh (“Mesh OK.”) but the extended check reports “Failed 3 mesh checks.”. The small-determinant cells and low-weight faces sit at the rear lower corners of the body; the concave cells are spread through the prism layers. I gated on the standard check and carry the extended failures as a limitation; their effect on drag was never tested.
The same holds for every tandem mesh: at x/L 0.5 (1,006,872 cells) the standard log reads “Mesh OK.” and the extended log “Failed 3 mesh checks.”, with 41,641 concave cells. All eight gap meshes fail the same three extended checks.
Body y+ (min 3.76, mean 33.6, max 328) is on average inside the wall-function range, but the floor away from the refined box reaches min 33.0, mean 90.4, max 451, outside it. The ladder grids are not the sweep meshes: the n2 rung (1,007,017 cells) is a separate realisation of the x/L 0.5 recipe, not the 1,006,872-cell sweep mesh.
7Results
Isolated body: Cd 0.2798 against 0.30 (Pagliarella, Table 4.1, same Reynolds number, −6.7 %) and 0.299 (Meile, full scale, −6.4 %). A comparison on one mesh with no numerical uncertainty.
Data table (8 rows)
| Gap x/L from the lead-body base | Experiment (Pagliarella 2009, Fig. 4.1a, digitised) | Simulation, k-omega SST (bars: iterative scatter) |
|---|---|---|
| 0.125 | 0.4052 | 0.312 |
| 0.25 | 0.3612 | 0.314 |
| 0.375 | 0.4695 | 0.338 |
| 0.5 | 0.6285 | 0.555 |
| 0.75 | 0.767 | 0.753 |
| 1 | 0.8481 | 0.875 |
| 1.5 | 0.9462 | 0.958 |
| 2 | 1.024 | 0.983 |
Data table (8 rows)
| Gap x/L from the lead-body base | Experiment (Pagliarella 2009, Fig. 4.1a, digitised) | Simulation, k-omega SST (bars: iterative scatter) |
|---|---|---|
| 0.125 | 1.303 | 1.193 |
| 0.25 | 1.3855 | 1.479 |
| 0.375 | 1.3431 | 1.284 |
| 0.5 | 1.1933 | 1.277 |
| 0.75 | 1.039 | 1.143 |
| 1 | 0.9859 | 1.093 |
| 1.5 | 0.9571 | 1.001 |
| 2 | 0.9522 | 1.021 |
| Quantity | Experiment | Simulation | Signed difference |
|---|---|---|---|
| Isolated Cd, against Pagliarella 2009 (Table 4.1, same Reynolds number) | 0.30 | 0.2798 | −6.7 % |
| Isolated Cd, against Meile 2011 (full scale) | 0.299 | 0.2798 | −6.4 % |
| Isolated Cl, against Meile 2011 (full scale) | 0.345 | 0.3181 | −7.8 % |
| Lead ratio, x/L 0.125 | 0.405 | 0.312 | −23 % |
| Trail ratio, x/L 0.125 | 1.303 | 1.193 | −8.5 % |
| Lead ratio, x/L 0.25 | 0.361 | 0.314 | −13 % |
| Trail ratio, x/L 0.25 (peak) | 1.386 | 1.479 | +6.7 % |
| Lead ratio, x/L 0.375 (late window) | 0.469 | 0.338 | −28.0 % |
| Trail ratio, x/L 0.375 (late window) | 1.343 | 1.284 | −4.4 % |
| Lead ratio, x/L 0.5 (start-dependent, see below) | 0.628 | 0.555 | −12 % |
| Trail ratio, x/L 0.5 (start-dependent, see below) | 1.193 | 1.277 | +7.0 % |
| Trail ratio, x/L 1.0 | 0.986 | 1.093 | +11 % |
| Lead ratio, x/L 2.0 | 1.024 | 0.983 | −4 % |
| Trail ratio, x/L 2.0 | 0.952 | 1.021 | +7 % |
Steady RANS (k-omega SST) drag ratios C_D / C_D,isolated for two 75 % Ahmed bodies in line, 8 gaps, one mesh per gap, compared with Pagliarella (2009) Fig. 4.1a. The trend (lead drag falling, trail drag peaking near x/L 0.25) is reproduced; the lead body is 12 to 28 % low at close gaps and the trail 4 to 11 % high at several gaps. Bars show iterative scatter only. No grid convergence: a four-grid ladder (0.19 to 6.96 million cells) did not converge. A comparison, not a validation.
The x/L 0.5 point depends on how the solution was started and on the mesh realisation. Three starts on a ladder mesh gave lead ratios of 0.495, 0.524 and 0.527; running the sweep case on to iteration 3000 gave 0.557 and 1.280. Across these, the lead ratio spans 0.495 to 0.557 and the trail 1.277 to 1.345, against 0.628 and 1.193 measured. The lead deficit appears under every start; its size does not hold to better than that spread.
The trail-body excess depends on the normaliser. My isolated Cd is −6.7 % below the thesis's own isolated value, and every ratio is divided by mine; the thesis divides by its own isolated body measured at the matching position. Part of the apparent trail overshoot is that difference, not the trail body.
8Numerical accuracy
None for any number on this page. The isolated body and each tandem gap ran on one mesh, so there is no discretisation uncertainty on the isolated Cd or on any ratio.
The one grid study is the four-grid ladder at x/L 0.5 in the mesh section. A four-grid ladder (0.19 to 6.96 million cells, same frozen recipe, wall distance held constant) did not converge; no numerical uncertainty can be estimated. The lead ratio oscillates with refinement and the trail ratio jumps on the finest grid. The shared GCI tool, run with the least-squares method of Eça and Hoekstra, returns no observed order for either body and flags both fits as bad (F_sigma 1.435 lead, 1.511 trail; it wants less than 1).
The ladder has defects of its own. Mean body y+ drifts by 27 % (lead) and 26 % (trail) across the rungs, above the 15 % limit I use, so wall-function error mixes into any order. Refinement is not geometrically similar (cell count grows 36.5 times where uniform refinement would give 64 times). The finest grid's lead drag settles only after about iteration 1750, so its averaging window includes transient.
Output of the shared GCI tool, unedited
Lead body, four grids, least squares (verdict lines; full output in the data file)
observed order p = n/a   (formal 2.0)   verdict: anomalous (oscillatory)
sigma = 0.1655   Delta_phi = 0.1153   F_sigma = 1.435  (want < 1)
WARNING: sigma=0.1655 >= Delta_phi=0.1153: BAD fit (F_sigma=1.44 > 1). U from eq (21); the paper says this 'indicates clearly that the data quality is bad'.
Trail body, four grids, least squares (verdict lines)
observed order p = n/a   (formal 2.0)   verdict: anomalous (p <= 0 in both delta_RE fits)
sigma = 0.1028   Delta_phi = 0.068   F_sigma = 1.511  (want < 1)
WARNING: sigma=0.1028 >= Delta_phi=0.068: BAD fit (F_sigma=1.51 > 1). U from eq (21); the paper says this 'indicates clearly that the data quality is bad'.
Lead body, three finest grids
GCI REFUSED: e32/e21 = -0.5202 < 0: NOT monotonically converging (oscillatory) -- Eca & Hoekstra 2014 classify this as ANOMALOUS. Report the spread, do not extrapolate.
From data/ahmed-25/ladder-gci.json (verdict_lead_4grid_lsr), data/ahmed-25/ladder-gci.json (verdict_trail_4grid_lsr), data/ahmed-25/ladder-gci.json (verdict_lead_3grid_finest), written by pipeline/build_assets.py.
9Why they differ, and what I distrust
Limits, as recorded in the ledger. A comparison, not a validation, on one mesh per case. The isolated Cd is 6-7 % below two experiments; the like-for-like one is Pagliarella's 0.30 (same scale and Reynolds number), Meile's 0.299 is full scale at Re 2.78e6 in an open jet. The tandem trend is reproduced, but the lead body is 12-28 % low at close gaps (cause open) and the trail 4-11 % high at several gaps, partly because every ratio is divided by my own isolated Cd. Simulation bars are iterative scatter; the x/L 0.5 point moves 0.495-0.557 (lead) with start and mesh. The four-grid ladder did not converge (y+ drift 27 % / 26 %, non-similar refinement), so no band is quoted. Extended checkMesh fails 3 checks on every mesh. Stings, wall boundary layers and flow angularity not modelled; the experimental series is digitised from a thesis figure, licence not stated. The 35/25 cases are excluded (wrong branch, mixed normaliser).
- The lead-body deficit at close gaps has no known cause. Convection-scheme controls, the support stings and flow angularity were looked at and none explains it; the lead-base pressure has the opposite sign to the experiment's. I do not call it agreement, and I do not name a cause.
- Steady RANS on an unsteady wake: at the closest gaps the instantaneous drag swings by about as much as its mean, and x/L 0.375 changed regime late in the run. The x/L 0.5 point is start- and mesh-dependent (lead 0.495 to 0.557).
- The isolated Cd is the denominator of every ratio, and it comes from one mesh with no grid study. Because mine is below the thesis's, the trail ratios read high partly for that reason.
- Extended checkMesh fails three checks on the isolated mesh and on all eight gap meshes; the effect on drag is untested. The floor y+ leaves the wall-function range away from the refined box.
- Not modelled: the support stings and mounting plate, the tunnel-wall boundary layers (walls are free-slip) and the tunnel's flow angularity. The floor boundary layer is thinner than the tunnel's.
- The experimental series is my digitisation of a thesis figure, and its error bars are instrument-chain only. The Meile value is at a different scale and Reynolds number, so its −6.4 % gap is not an error estimate either.
10References
- R. M. Pagliarella (2009), “On the Aerodynamic Performance of Automotive Vehicle Platoons Featuring Pre and Post-Critical Leading Forms”, PhD thesis, School of Aerospace, Mechanical and Manufacturing Engineering, RMIT University. Table 4.1 (isolated Cd) and Fig. 4.1a (tandem drag ratios, digitised by me).
- W. Meile, G. Brenn, A. Reppenhagen, B. Lechner, A. Fuchs (2011), “Experiments and numerical simulations on the aerodynamics of the Ahmed body”, CFD Letters 3(1). Fig. 4a (Cd and Cl at the highest Reynolds number).
- L. Eça and M. Hoekstra (2014), least-squares procedure for grid-convergence uncertainty, Journal of Computational Physics; used through the shared GCI tool.
Source files
D:/CFD/tandem-ahmed/cases/single25/postProcessing/forceCoeffs_lead_body/0/coefficient.datD:/CFD/tandem-ahmed/cases/single25/log.checkMeshD:/CFD/tandem-ahmed/cases/single25/log.checkMesh.extendedD:/CFD/tandem-ahmed/cases/single25/log.simpleFoamD:/CFD/tandem-ahmed/cases/single25/system/controlDictD:/CFD/tandem-ahmed/cases/single25/0.orig/D:/CFD/tandem-ahmed/cases/single25/SPEC.mdD:/CFD/tandem-ahmed/cases/tandem_25_25_g<gap>/postProcessing/forceCoeffs_{lead,trail}_body/D:/CFD/tandem-ahmed/cases/tandem_25_25_g0.5/log.checkMesh.extendedD:/CFD/tandem-ahmed/RESULTS-single25.mdD:/CFD/tandem-ahmed/RESULTS-tandem-25-25.mdD:/CFD/tandem-ahmed/RESULTS-ladder-x0.5.mdD:/CFD/tandem-ahmed/S0-RESULTS.mdD:/CFD/data/bluff-body/tandem-ahmed/pagliarella_fig4-1a_CD_ratio.csvD:/CFD/tools/lit/meile-ahmed-body-cfd-letters-2011__f6d7d91f.txtinvestigation/lane-F-tandem-ahmed.md (evidence audit)pipeline/case_data/ahmed-25.py (chart data and GCI tool output)
Last updated 2026-11-14. One-page summary (prints to one A4 page), also as a PDF. Every number on this page is checked against its source file by pipeline/check_numbers.py.