Tall-cavity natural convection: mean Nusselt number 20 % below the quoted experiment, and refining the grid does not close the gap
I ran wall-resolved k-omega SST on four systematically refined grids of the cavity mid-plane. The grid changes mean Nu by little: the numerical uncertainty is 0.55 %, and the gap to the experimental value is about 47 times that. The gap therefore comes from the model, the inputs, the measurement or the way the experiment defines Nu, and with the data I have I cannot tell which.
- Mean Nu, simulation
- 4.658
- finest of four grids
- Mean Nu, experiment
- 5.85
- quoted second-hand (KBwiki UFR 4-10)
- Signed difference
- −20.4 %
- simulation minus experiment
- Numerical uncertainty
- ±0.025
- least squares on four grids, 95 %
2Geometry, mesh, results
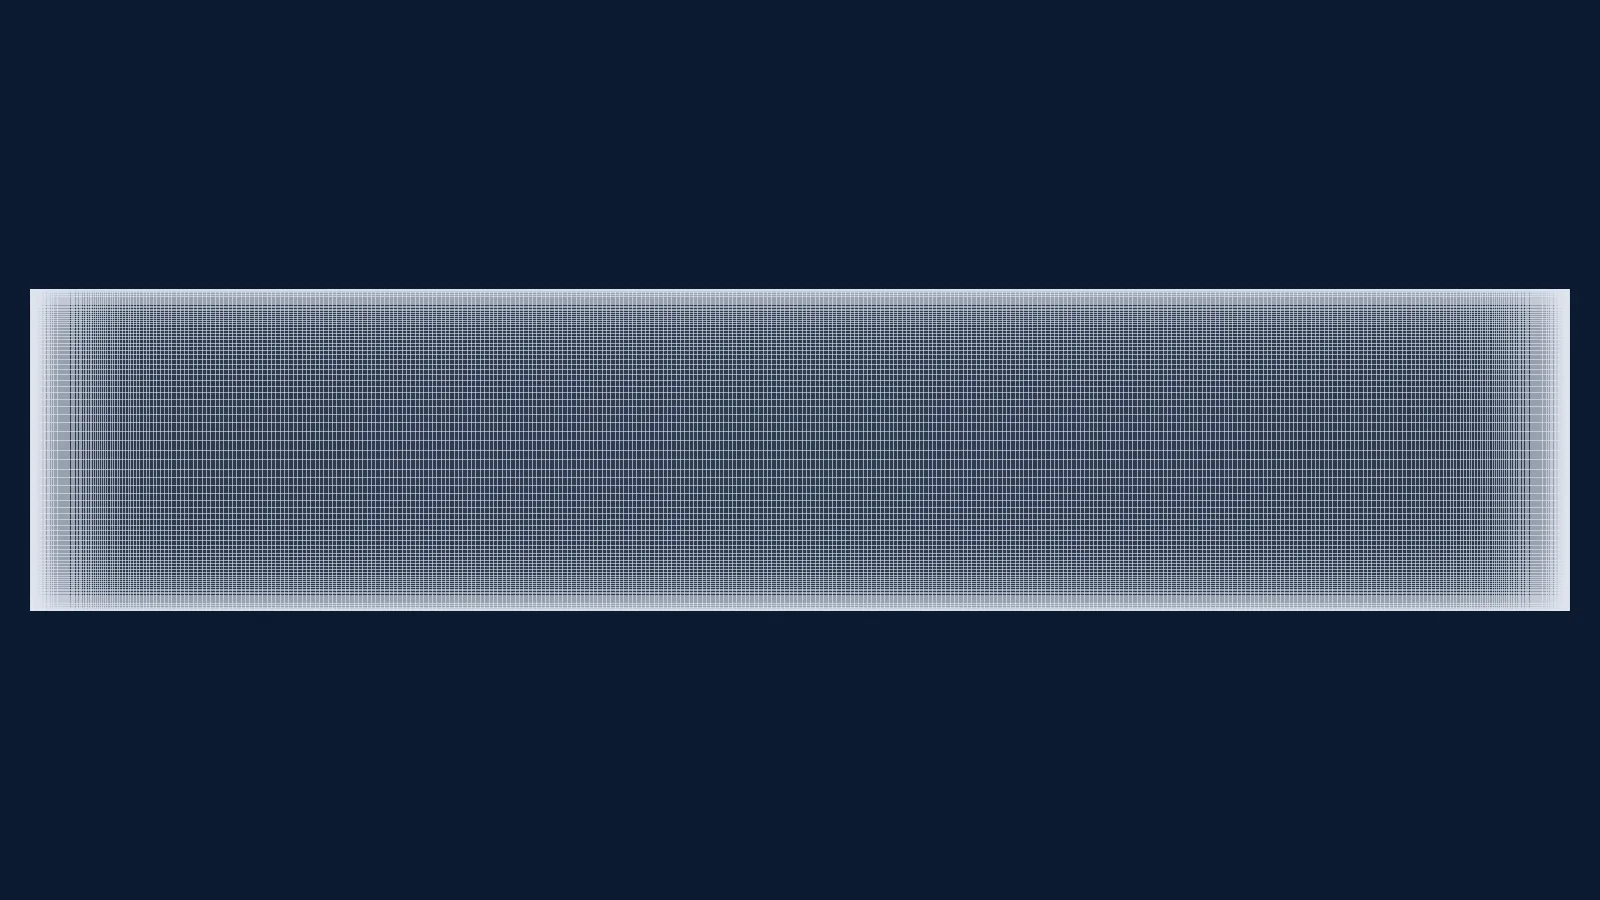
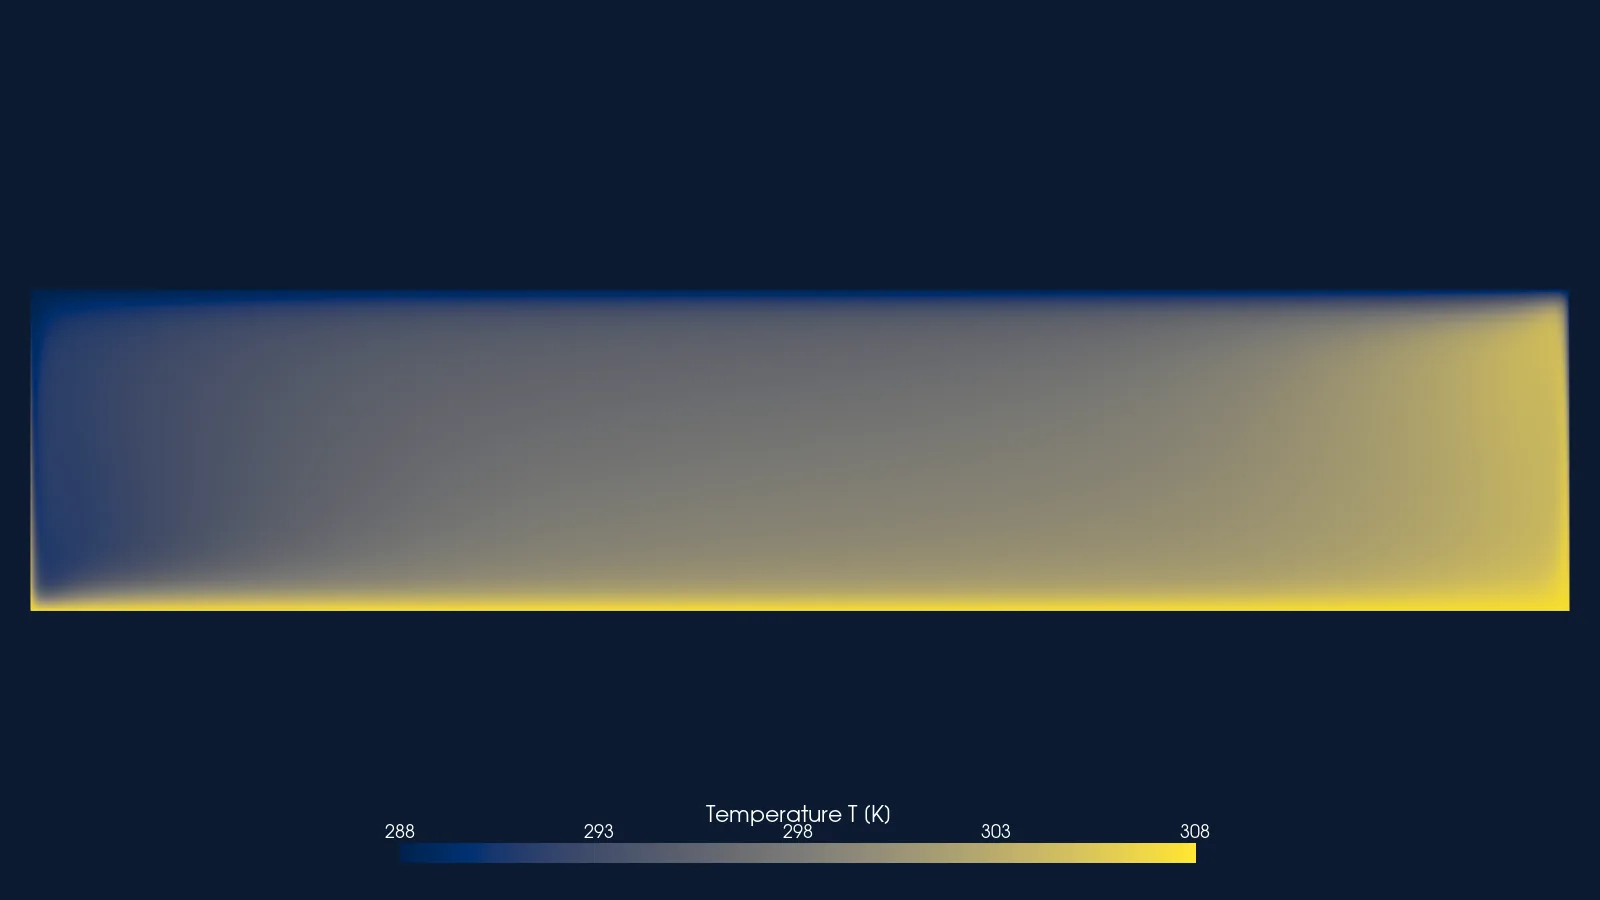
Tall air-filled cavity, 2-D section: heated and cooled side walls, top and bottom walls held at the measured temperature profile; walls drawn as lines. Not to scale: the cavity is 28.7 times taller than wide, so its width is drawn 6 times true scale and it is turned on its side (hot wall at the bottom, top end at the right); probe positions are in true coordinates.
Not to scale: x drawn 6 times true scale. Probe positions are given in true coordinates.

No poster exported for this step.
Drag to pan, wheel or pinch to zoom, click to read a value. Keys: arrows pan, + and − zoom, Enter reads the value at the centre.
3Case parameters
| Rayleigh number (cavity width) | 0.86 × 10⁶ |
|---|---|
| Height, width, depth | 2.18 m, 0.076 m, 0.52 m |
| Wall temperatures | 307.75 K and 288.15 K (19.6 K) |
| Fluid | Air, Pr 0.705 |
| Solver | OpenFOAM v2412, buoyantSimpleFoam |
| Turbulence model | k-omega SST, wall-resolved |
| Wall y+ max | 0.097 finest, 0.26 coarsest |
| Cells | 8,000 to 64,410 |
| Fluid properties | perfect gas, constant properties: Cp 1004.4 J/kg K, viscosity 1.831e-05 Pa s, molar mass 28.96 kg/kmol |
| Gravity | (0 −9.81 0) m/s² |
| Run cost | Not recorded |
4Experiment
Betts and Bokhari built an air-filled cavity 2.18 m high, 0.076 m wide and 0.52 m deep, with isothermal aluminium side walls 19.6 K apart and 5 cm hard rubber, k = 0.155 W/mK top and bottom walls with thermocouples at mid-thickness. Velocity was measured by laser-Doppler velocimetry and temperature with a traversed thermocouple. The source describes the flow on the mid-plane as closely two-dimensional.
The open ERCOFTAC files give mean temperature and mean vertical velocity across the cavity at 9 heights (y/H 0.05 to 0.95), temperature normal to the floor and roof at x = 38.1 mm, and the temperature inside the rubber walls, which I used as boundary conditions. The mean Nusselt number 5.85 is not in those files: it is quoted on the ERCOFTAC KBwiki page UFR 4-10, without its definition.
One file has a defect: at y/H 0.10, four points at x = 40.6–55.8 mm alternate 4–5 K above their neighbours. They are plotted as given.
| Stated uncertainty | Not stated in the source. The experimental uncertainty and the experiment's definition of the mean Nusselt number are on neither open page; the journal paper is closed access and I have not read it. |
|---|---|
| Blockage and corrections | Not applicable: a closed cavity, no tunnel. |
| Licence | ERCOFTAC Classic Collection case 079 (University of Manchester), data of Betts and Bokhari, CC BY-NC-SA 4.0. The tables and CSV files here are derived from that data and carry the same licence. |
Mean temperature at y/H 0.5 (x in mm, T in °C)
Experimental values (51 points)
| x from the cold wall (mm) | Experiment (Betts and Bokhari) |
|---|---|
| 0.33 | 15.62 |
| 0.58 | 15.94 |
| 0.84 | 16.45 |
| 1.09 | 16.78 |
| 1.6 | 17.58 |
| 2.11 | 18.48 |
| 2.61 | 19.05 |
| 3.25 | 19.43 |
| 3.88 | 19.96 |
| 5.15 | 20.46 |
| 6.42 | 21.32 |
| 7.69 | 21.74 |
| 8.96 | 22.01 |
| 10.23 | 22.21 |
| 11.5 | 22.53 |
| 12.77 | 22.74 |
| 15.31 | 23.02 |
| 17.85 | 23.35 |
| 20.39 | 23.76 |
| 22.93 | 23.69 |
| 25.47 | 24.17 |
| 28.01 | 24.25 |
| 30.55 | 25.08 |
| 33.09 | 25.15 |
| 35.63 | 25.33 |
| 38.17 | 25.26 |
| 40.57 | 25.23 |
| 43.11 | 25.57 |
| 45.65 | 25.92 |
| 48.19 | 26.12 |
| 50.73 | 25.87 |
| 53.27 | 26.3 |
| 55.81 | 26.55 |
| 58.35 | 26.99 |
| 60.89 | 27.05 |
| 63.43 | 27.53 |
| 64.7 | 27.65 |
| 65.97 | 27.77 |
| 67.24 | 27.71 |
| 68.51 | 28.38 |
| 69.78 | 28.61 |
| 71.05 | 29.44 |
| 72.32 | 30.06 |
| 72.95 | 30.5 |
| 73.59 | 31.12 |
| 74.09 | 31.66 |
| 74.6 | 32.37 |
| 75.11 | 33.08 |
| 75.36 | 33.37 |
| 75.62 | 33.94 |
| 75.87 | 34.21 |
Mean vertical velocity at y/H 0.5 (x in mm, V in m/s)
Experimental values (28 points)
| x from the cold wall (mm) | Experiment (Betts and Bokhari) |
|---|---|
| 1.2 | -0.081 |
| 2.2 | -0.115 |
| 3.2 | -0.124 |
| 4.2 | -0.133 |
| 6.2 | -0.135 |
| 8.2 | -0.134 |
| 10.2 | -0.12 |
| 12.2 | -0.112 |
| 14.2 | -0.11 |
| 16.2 | -0.1 |
| 18.2 | -0.089 |
| 23.2 | -0.062 |
| 28.2 | -0.048 |
| 33.2 | -0.011 |
| 38.2 | 0.012 |
| 43.2 | 0.041 |
| 48.2 | 0.054 |
| 53.2 | 0.077 |
| 58.2 | 0.091 |
| 60.2 | 0.099 |
| 62.2 | 0.106 |
| 64.2 | 0.12 |
| 66.2 | 0.127 |
| 68.2 | 0.133 |
| 70.2 | 0.137 |
| 71.2 | 0.14 |
| 72.2 | 0.131 |
| 73.2 | 0.121 |
Mean temperature at all nine heights, as distributed
Mean vertical velocity at all nine heights, as distributed
Temperature normal to the floor and roof at x 38.1 mm, as distributed
5Set-up
A 2-D slice of the cavity mid-plane, 2.18 m by 0.076 m, one cell (0.01 m) thick with empty front and back faces. The parent case is the stock buoyantCavity tutorial (3-D, wall functions, adiabatic top and bottom). I changed three things on purpose: the 2-D slice, wall-resolved SST, and top and bottom walls held at the measured rubber-wall temperature instead of adiabatic.
The cavity is closed, so there is no inlet or outlet: the flow is driven by the 19.6 K between the side walls. Values below are from the finest grid's 0/ files; the other grids use the same recipe.
| Boundary | Type | Value |
|---|---|---|
| Hot wall (x = W) | no-slip; fixed temperature | 307.75 K |
| Cold wall (x = 0) | no-slip; fixed temperature | 288.15 K |
| Bottom and top walls | no-slip; fixed temperature, one value per face | non-uniform list of measured values (the rubber-wall temperature profile) |
| All four walls, turbulence | k fixed; omega omegaWallFunction; nut nutLowReWallFunction; alphat compressible::alphatWallFunction | k 1e-12 m²/s²; turbulent Prandtl number 0.85 |
| All four walls, pressure | fixedFluxPressure (p_rgh) | 1e5 Pa |
| Front and back | empty (2-D) |
Numerics and convergence
Steady buoyantSimpleFoam with gravity (0 −9.81 0) m/s², initial temperature 297.95 K. Convection terms for U, energy and turbulence: bounded Gauss limitedLinear 0.2. Pressure relaxation 0.7.
Convergence was judged from the Nusselt-number history. The finest grid was extended from 20,000 to 35,000 iterations because Nu was still drifting in one direction. At the end, the hot-wall Nu varies by 2.17e-05 (relative) over the last 2000 iterations, and the heat balance over all walls closes to 7 × 10⁻⁵ of the wall flux.
The Nusselt number is my definition, Nu = q_mean W / (k ΔT), with W the cavity width and k from Cp, viscosity and Prandtl number. On the finest grid the hot wall gives 4.6607 and the cold wall 4.6551; the page uses their mean.
6Mesh
| Cells, finest grid | 64,410 |
|---|---|
| Structure | One block, 114 × 565 cells, graded towards every wall |
| y+ max, finest grid (cold wall) | 0.097 |
| Max non-orthogonality | 0 |
| Max skewness | 1.2e-11 |
| Max aspect ratio | 80 |
| checkMesh verdict, finest grid | “Mesh OK.” |
| Grid | Cells | Iterations | Mean Nu | vs experiment | checkMesh |
|---|---|---|---|---|---|
| g0.5 (coarsest) | 8,000 | 20,000 | 4.5962 | −21.43 % | “Mesh OK.” |
| g0.7071 | 15,848 | 20,000 | 4.6262 | −20.92 % | “Mesh OK.” |
| g1.0 | 32,000 | 20,000 | 4.6459 | −20.58 % | “Mesh OK.” |
| g1.4142 (finest) | 64,410 | 35,000 | 4.6579 | −20.38 % | “Mesh OK.” |
Every grid passed checkMesh; the log of each exact mesh was read before it was solved. The mesh is a single orthogonal block, so non-orthogonality is zero and skewness is at round-off level.
7Results
On the finest of four grids the mean Nusselt number is 4.658 ±0.025, against 5.85 quoted for the experiment: −20.4 %.
Data table (4 rows)
| Cells | Simulation, k-omega SST | Least-squares extrapolation | Experiment (quoted, KBwiki UFR 4-10) |
|---|---|---|---|
| 8000 | 4.5962 | 4.678092 | 5.85 |
| 15848 | 4.6262 | 4.678092 | 5.85 |
| 32000 | 4.6459 | 4.678092 | 5.85 |
| 64410 | 4.6579 | 4.678092 | 5.85 |
Data tables, one per series (51 points, 400 points)
| x from the cold wall (mm) | Experiment (Betts and Bokhari) |
|---|---|
| 0.33 | 15.62 |
| 0.58 | 15.94 |
| 0.84 | 16.45 |
| 1.09 | 16.78 |
| 1.6 | 17.58 |
| 2.11 | 18.48 |
| 2.61 | 19.05 |
| 3.25 | 19.43 |
| 3.88 | 19.96 |
| 5.15 | 20.46 |
| 6.42 | 21.32 |
| 7.69 | 21.74 |
| 8.96 | 22.01 |
| 10.23 | 22.21 |
| 11.5 | 22.53 |
| 12.77 | 22.74 |
| 15.31 | 23.02 |
| 17.85 | 23.35 |
| 20.39 | 23.76 |
| 22.93 | 23.69 |
| 25.47 | 24.17 |
| 28.01 | 24.25 |
| 30.55 | 25.08 |
| 33.09 | 25.15 |
| 35.63 | 25.33 |
| 38.17 | 25.26 |
| 40.57 | 25.23 |
| 43.11 | 25.57 |
| 45.65 | 25.92 |
| 48.19 | 26.12 |
| 50.73 | 25.87 |
| 53.27 | 26.3 |
| 55.81 | 26.55 |
| 58.35 | 26.99 |
| 60.89 | 27.05 |
| 63.43 | 27.53 |
| 64.7 | 27.65 |
| 65.97 | 27.77 |
| 67.24 | 27.71 |
| 68.51 | 28.38 |
| 69.78 | 28.61 |
| 71.05 | 29.44 |
| 72.32 | 30.06 |
| 72.95 | 30.5 |
| 73.59 | 31.12 |
| 74.09 | 31.66 |
| 74.6 | 32.37 |
| 75.11 | 33.08 |
| 75.36 | 33.37 |
| 75.62 | 33.94 |
| 75.87 | 34.21 |
| x from the cold wall (mm) | Simulation, finest grid |
|---|---|
| 0 | 15 |
| 0.19047619 | 15.21713 |
| 0.38095238 | 15.43368 |
| 0.57142857 | 15.65103 |
| 0.76190476 | 15.86871 |
| 0.95238095 | 16.08389 |
| 1.1428571 | 16.30177 |
| 1.3333333 | 16.51896 |
| 1.5238095 | 16.73444 |
| 1.7142857 | 16.94998 |
| 1.9047619 | 17.16543 |
| 2.0952381 | 17.38057 |
| 2.2857143 | 17.59512 |
| 2.4761905 | 17.80871 |
| 2.6666667 | 18.02061 |
| 2.8571429 | 18.22754 |
| 3.047619 | 18.43167 |
| 3.2380952 | 18.63535 |
| 3.4285714 | 18.83408 |
| 3.6190476 | 19.02481 |
| 3.8095238 | 19.21273 |
| 4 | 19.39312 |
| 4.1904762 | 19.56593 |
| 4.3809524 | 19.73302 |
| 4.5714286 | 19.88984 |
| 4.7619048 | 20.03991 |
| 4.952381 | 20.18111 |
| 5.1428571 | 20.31474 |
| 5.3333333 | 20.44073 |
| 5.5238095 | 20.55903 |
| 5.7142857 | 20.67083 |
| 5.9047619 | 20.77486 |
| 6.0952381 | 20.87337 |
| 6.2857143 | 20.96598 |
| 6.4761905 | 21.05355 |
| 6.6666667 | 21.13685 |
| 6.8571429 | 21.21532 |
| 7.047619 | 21.28917 |
| 7.2380952 | 21.35938 |
| 7.4285714 | 21.42642 |
| 7.6190476 | 21.4908 |
| 7.8095238 | 21.55104 |
| 8 | 21.60914 |
| 8.1904762 | 21.66546 |
| 8.3809524 | 21.71822 |
| 8.5714286 | 21.76938 |
| 8.7619048 | 21.81903 |
| 8.952381 | 21.86599 |
| 9.1428571 | 21.91183 |
| 9.3333333 | 21.9558 |
| 9.5238095 | 21.99831 |
| 9.7142857 | 22.03996 |
| 9.9047619 | 22.07931 |
| 10.095238 | 22.11824 |
| 10.285714 | 22.15558 |
| 10.47619 | 22.19218 |
| 10.666667 | 22.22731 |
| 10.857143 | 22.26183 |
| 11.047619 | 22.2955 |
| 11.238095 | 22.32816 |
| 11.428571 | 22.35984 |
| 11.619048 | 22.39097 |
| 11.809524 | 22.4215 |
| 12 | 22.45124 |
| 12.190476 | 22.47996 |
| 12.380952 | 22.50844 |
| 12.571429 | 22.53627 |
| 12.761905 | 22.56391 |
| 12.952381 | 22.5901 |
| 13.142857 | 22.61628 |
| 13.333333 | 22.64191 |
| 13.52381 | 22.66741 |
| 13.714286 | 22.69212 |
| 13.904762 | 22.71612 |
| 14.095238 | 22.74007 |
| 14.285714 | 22.76355 |
| 14.47619 | 22.78704 |
| 14.666667 | 22.80963 |
| 14.857143 | 22.83172 |
| 15.047619 | 22.8538 |
| 15.238095 | 22.87553 |
| 15.428571 | 22.89726 |
| 15.619048 | 22.9184 |
| 15.809524 | 22.93884 |
| 16 | 22.95929 |
| 16.190476 | 22.97956 |
| 16.380952 | 22.99976 |
| 16.571429 | 23.01996 |
| 16.761905 | 23.03903 |
| 16.952381 | 23.05804 |
| 17.142857 | 23.07704 |
| 17.333333 | 23.09591 |
| 17.52381 | 23.11477 |
| 17.714286 | 23.13354 |
| 17.904762 | 23.15129 |
| 18.095238 | 23.16904 |
| 18.285714 | 23.1868 |
| 18.47619 | 23.2045 |
| 18.666667 | 23.22221 |
| 18.857143 | 23.23991 |
| 19.047619 | 23.25671 |
| 19.238095 | 23.27337 |
| 19.428571 | 23.29003 |
| 19.619048 | 23.30679 |
| 19.809524 | 23.32363 |
| 20 | 23.34047 |
| 20.190476 | 23.35706 |
| 20.380952 | 23.37291 |
| 20.571429 | 23.38876 |
| 20.761905 | 23.40461 |
| 20.952381 | 23.42085 |
| 21.142857 | 23.43723 |
| 21.333333 | 23.45362 |
| 21.52381 | 23.46978 |
| 21.714286 | 23.4852 |
| 21.904762 | 23.50062 |
| 22.095238 | 23.51604 |
| 22.285714 | 23.53183 |
| 22.47619 | 23.54799 |
| 22.666667 | 23.56414 |
| 22.857143 | 23.5803 |
| 23.047619 | 23.59574 |
| 23.238095 | 23.61095 |
| 23.428571 | 23.62616 |
| 23.619048 | 23.64137 |
| 23.809524 | 23.65716 |
| 24 | 23.6731 |
| 24.190476 | 23.68904 |
| 24.380952 | 23.70497 |
| 24.571429 | 23.72014 |
| 24.761905 | 23.73515 |
| 24.952381 | 23.75015 |
| 25.142857 | 23.76516 |
| 25.333333 | 23.78057 |
| 25.52381 | 23.79622 |
| 25.714286 | 23.81187 |
| 25.904762 | 23.82752 |
| 26.095238 | 23.84281 |
| 26.285714 | 23.85755 |
| 26.47619 | 23.87229 |
| 26.666667 | 23.88704 |
| 26.857143 | 23.90178 |
| 27.047619 | 23.91704 |
| 27.238095 | 23.93235 |
| 27.428571 | 23.94766 |
| 27.619048 | 23.96297 |
| 27.809524 | 23.97789 |
| 28 | 23.99231 |
| 28.190476 | 24.00674 |
| 28.380952 | 24.02116 |
| 28.571429 | 24.03558 |
| 28.761905 | 24.05036 |
| 28.952381 | 24.06531 |
| 29.142857 | 24.08026 |
| 29.333333 | 24.09521 |
| 29.52381 | 24.11016 |
| 29.714286 | 24.12431 |
| 29.904762 | 24.1384 |
| 30.095238 | 24.15249 |
| 30.285714 | 24.16657 |
| 30.47619 | 24.18066 |
| 30.666667 | 24.1952 |
| 30.857143 | 24.20982 |
| 31.047619 | 24.22443 |
| 31.238095 | 24.23905 |
| 31.428571 | 24.25366 |
| 31.619048 | 24.2676 |
| 31.809524 | 24.28138 |
| 32 | 24.29515 |
| 32.190476 | 24.30892 |
| 32.380952 | 24.3227 |
| 32.571429 | 24.33672 |
| 32.761905 | 24.35107 |
| 32.952381 | 24.36541 |
| 33.142857 | 24.37975 |
| 33.333333 | 24.3941 |
| 33.52381 | 24.40839 |
| 33.714286 | 24.42192 |
| 33.904762 | 24.43544 |
| 34.095238 | 24.44896 |
| 34.285714 | 24.46249 |
| 34.47619 | 24.47601 |
| 34.666667 | 24.48976 |
| 34.857143 | 24.50392 |
| 35.047619 | 24.51809 |
| 35.238095 | 24.53225 |
| 35.428571 | 24.54642 |
| 35.619048 | 24.56058 |
| 35.809524 | 24.57423 |
| 36 | 24.58759 |
| 36.190476 | 24.60095 |
| 36.380952 | 24.61431 |
| 36.571429 | 24.62767 |
| 36.761905 | 24.64103 |
| 36.952381 | 24.65458 |
| 37.142857 | 24.66827 |
| 37.333333 | 24.68196 |
| 37.52381 | 24.69566 |
| 37.714286 | 24.70935 |
| 37.904762 | 24.72304 |
| 38.095238 | 24.73674 |
| 38.285714 | 24.75043 |
| 38.47619 | 24.76412 |
| 38.666667 | 24.77782 |
| 38.857143 | 24.79151 |
| 39.047619 | 24.8052 |
| 39.238095 | 24.81876 |
| 39.428571 | 24.83213 |
| 39.619048 | 24.84551 |
| 39.809524 | 24.85888 |
| 40 | 24.87226 |
| 40.190476 | 24.88564 |
| 40.380952 | 24.8993 |
| 40.571429 | 24.91349 |
| 40.761905 | 24.92767 |
| 40.952381 | 24.94186 |
| 41.142857 | 24.95604 |
| 41.333333 | 24.97022 |
| 41.52381 | 24.984 |
| 41.714286 | 24.99755 |
| 41.904762 | 25.01111 |
| 42.095238 | 25.02466 |
| 42.285714 | 25.03822 |
| 42.47619 | 25.05178 |
| 42.666667 | 25.06611 |
| 42.857143 | 25.08049 |
| 43.047619 | 25.09486 |
| 43.238095 | 25.10924 |
| 43.428571 | 25.12362 |
| 43.619048 | 25.13769 |
| 43.809524 | 25.15151 |
| 44 | 25.16533 |
| 44.190476 | 25.17915 |
| 44.380952 | 25.19298 |
| 44.571429 | 25.20696 |
| 44.761905 | 25.22163 |
| 44.952381 | 25.2363 |
| 45.142857 | 25.25096 |
| 45.333333 | 25.26563 |
| 45.52381 | 25.28022 |
| 45.714286 | 25.29437 |
| 45.904762 | 25.30852 |
| 46.095238 | 25.32267 |
| 46.285714 | 25.33682 |
| 46.47619 | 25.35104 |
| 46.666667 | 25.36605 |
| 46.857143 | 25.38107 |
| 47.047619 | 25.39609 |
| 47.238095 | 25.4111 |
| 47.428571 | 25.42595 |
| 47.619048 | 25.44045 |
| 47.809524 | 25.45495 |
| 48 | 25.46945 |
| 48.190476 | 25.48395 |
| 48.380952 | 25.49895 |
| 48.571429 | 25.51434 |
| 48.761905 | 25.52973 |
| 48.952381 | 25.54512 |
| 49.142857 | 25.56047 |
| 49.333333 | 25.5753 |
| 49.52381 | 25.59013 |
| 49.714286 | 25.60496 |
| 49.904762 | 25.61979 |
| 50.095238 | 25.63517 |
| 50.285714 | 25.65092 |
| 50.47619 | 25.66667 |
| 50.666667 | 25.68241 |
| 50.857143 | 25.69791 |
| 51.047619 | 25.71302 |
| 51.238095 | 25.72813 |
| 51.428571 | 25.74324 |
| 51.619048 | 25.7585 |
| 51.809524 | 25.77455 |
| 52 | 25.79059 |
| 52.190476 | 25.80664 |
| 52.380952 | 25.82253 |
| 52.571429 | 25.83786 |
| 52.761905 | 25.85318 |
| 52.952381 | 25.86851 |
| 53.142857 | 25.88406 |
| 53.333333 | 25.90034 |
| 53.52381 | 25.91661 |
| 53.714286 | 25.93289 |
| 53.904762 | 25.9488 |
| 54.095238 | 25.96436 |
| 54.285714 | 25.97991 |
| 54.47619 | 25.99547 |
| 54.666667 | 26.01177 |
| 54.857143 | 26.02829 |
| 55.047619 | 26.04481 |
| 55.238095 | 26.06121 |
| 55.428571 | 26.07723 |
| 55.619048 | 26.09325 |
| 55.809524 | 26.10927 |
| 56 | 26.12604 |
| 56.190476 | 26.14306 |
| 56.380952 | 26.16009 |
| 56.571429 | 26.17705 |
| 56.761905 | 26.19392 |
| 56.952381 | 26.2108 |
| 57.142857 | 26.22782 |
| 57.333333 | 26.24575 |
| 57.52381 | 26.26369 |
| 57.714286 | 26.28162 |
| 57.904762 | 26.29963 |
| 58.095238 | 26.31764 |
| 58.285714 | 26.33565 |
| 58.47619 | 26.35468 |
| 58.666667 | 26.37382 |
| 58.857143 | 26.39295 |
| 59.047619 | 26.41226 |
| 59.238095 | 26.43156 |
| 59.428571 | 26.45093 |
| 59.619048 | 26.47145 |
| 59.809524 | 26.49197 |
| 60 | 26.51256 |
| 60.190476 | 26.53336 |
| 60.380952 | 26.55415 |
| 60.571429 | 26.57566 |
| 60.761905 | 26.59776 |
| 60.952381 | 26.61986 |
| 61.142857 | 26.64235 |
| 61.333333 | 26.66485 |
| 61.52381 | 26.68787 |
| 61.714286 | 26.71179 |
| 61.904762 | 26.73571 |
| 62.095238 | 26.76014 |
| 62.285714 | 26.78462 |
| 62.47619 | 26.80984 |
| 62.666667 | 26.83586 |
| 62.857143 | 26.86201 |
| 63.047619 | 26.88877 |
| 63.238095 | 26.91553 |
| 63.428571 | 26.94378 |
| 63.619048 | 26.97223 |
| 63.809524 | 27.00137 |
| 64 | 27.03078 |
| 64.190476 | 27.06123 |
| 64.380952 | 27.09248 |
| 64.571429 | 27.1244 |
| 64.761905 | 27.15689 |
| 64.952381 | 27.1904 |
| 65.142857 | 27.22494 |
| 65.333333 | 27.26039 |
| 65.52381 | 27.29651 |
| 65.714286 | 27.33413 |
| 65.904762 | 27.37252 |
| 66.095238 | 27.41263 |
| 66.285714 | 27.45316 |
| 66.47619 | 27.49607 |
| 66.666667 | 27.53991 |
| 66.857143 | 27.58532 |
| 67.047619 | 27.63266 |
| 67.238095 | 27.68118 |
| 67.428571 | 27.73257 |
| 67.619048 | 27.78553 |
| 67.809524 | 27.84015 |
| 68 | 27.8986 |
| 68.190476 | 27.95888 |
| 68.380952 | 28.0214 |
| 68.571429 | 28.08836 |
| 68.761905 | 28.15809 |
| 68.952381 | 28.23115 |
| 69.142857 | 28.3081 |
| 69.333333 | 28.38987 |
| 69.52381 | 28.47673 |
| 69.714286 | 28.56808 |
| 69.904762 | 28.66468 |
| 70.095238 | 28.76744 |
| 70.285714 | 28.87595 |
| 70.47619 | 28.99241 |
| 70.666667 | 29.11563 |
| 70.857143 | 29.2465 |
| 71.047619 | 29.38526 |
| 71.238095 | 29.53131 |
| 71.428571 | 29.68643 |
| 71.619048 | 29.84766 |
| 71.809524 | 30.01925 |
| 72 | 30.19584 |
| 72.190476 | 30.3797 |
| 72.380952 | 30.57068 |
| 72.571429 | 30.76371 |
| 72.761905 | 30.96444 |
| 72.952381 | 31.16971 |
| 73.142857 | 31.37484 |
| 73.333333 | 31.58248 |
| 73.52381 | 31.79483 |
| 73.714286 | 32.00862 |
| 73.904762 | 32.22318 |
| 74.095238 | 32.4382 |
| 74.285714 | 32.65341 |
| 74.47619 | 32.86865 |
| 74.666667 | 33.08379 |
| 74.857143 | 33.30061 |
| 75.047619 | 33.5181 |
| 75.238095 | 33.73289 |
| 75.428571 | 33.95018 |
| 75.619048 | 34.16712 |
| 75.809524 | 34.38327 |
| 76 | 34.6 |
Data tables, one per series (28 points, 400 points)
| x from the cold wall (mm) | Experiment (Betts and Bokhari) |
|---|---|
| 1.2 | -0.081 |
| 2.2 | -0.115 |
| 3.2 | -0.124 |
| 4.2 | -0.133 |
| 6.2 | -0.135 |
| 8.2 | -0.134 |
| 10.2 | -0.12 |
| 12.2 | -0.112 |
| 14.2 | -0.11 |
| 16.2 | -0.1 |
| 18.2 | -0.089 |
| 23.2 | -0.062 |
| 28.2 | -0.048 |
| 33.2 | -0.011 |
| 38.2 | 0.012 |
| 43.2 | 0.041 |
| 48.2 | 0.054 |
| 53.2 | 0.077 |
| 58.2 | 0.091 |
| 60.2 | 0.099 |
| 62.2 | 0.106 |
| 64.2 | 0.12 |
| 66.2 | 0.127 |
| 68.2 | 0.133 |
| 70.2 | 0.137 |
| 71.2 | 0.14 |
| 72.2 | 0.131 |
| 73.2 | 0.121 |
| x from the cold wall (mm) | Simulation, finest grid |
|---|---|
| 0 | 0 |
| 0.19047619 | -0.01422819 |
| 0.38095238 | -0.027666972 |
| 0.57142857 | -0.040404305 |
| 0.76190476 | -0.052442119 |
| 0.95238095 | -0.063690923 |
| 1.1428571 | -0.074342633 |
| 1.3333333 | -0.084315504 |
| 1.5238095 | -0.093588311 |
| 1.7142857 | -0.10224261 |
| 1.9047619 | -0.11027611 |
| 2.0952381 | -0.11769064 |
| 2.2857143 | -0.12449322 |
| 2.4761905 | -0.13069746 |
| 2.6666667 | -0.13631731 |
| 2.8571429 | -0.14132332 |
| 3.047619 | -0.14583334 |
| 3.2380952 | -0.14968719 |
| 3.4285714 | -0.15305235 |
| 3.6190476 | -0.15597194 |
| 3.8095238 | -0.15830435 |
| 4 | -0.1602388 |
| 4.1904762 | -0.16182647 |
| 4.3809524 | -0.16292278 |
| 4.5714286 | -0.1638498 |
| 4.7619048 | -0.16430148 |
| 4.952381 | -0.16467191 |
| 5.1428571 | -0.16468708 |
| 5.3333333 | -0.16466332 |
| 5.5238095 | -0.16434958 |
| 5.7142857 | -0.16405316 |
| 5.9047619 | -0.16351084 |
| 6.0952381 | -0.16298771 |
| 6.2857143 | -0.16233741 |
| 6.4761905 | -0.16164635 |
| 6.6666667 | -0.16093888 |
| 6.8571429 | -0.16012068 |
| 7.047619 | -0.15935074 |
| 7.2380952 | -0.15850318 |
| 7.4285714 | -0.15763556 |
| 7.6190476 | -0.15680231 |
| 7.8095238 | -0.15588253 |
| 8 | -0.15498444 |
| 8.1904762 | -0.15411152 |
| 8.3809524 | -0.15316198 |
| 8.5714286 | -0.15224128 |
| 8.7619048 | -0.15134774 |
| 8.952381 | -0.15039199 |
| 9.1428571 | -0.14944922 |
| 9.3333333 | -0.14854471 |
| 9.5238095 | -0.14760188 |
| 9.7142857 | -0.1466365 |
| 9.9047619 | -0.14572433 |
| 10.095238 | -0.14480832 |
| 10.285714 | -0.14384342 |
| 10.47619 | -0.14289744 |
| 10.666667 | -0.14198941 |
| 10.857143 | -0.14105893 |
| 11.047619 | -0.14009732 |
| 11.238095 | -0.1391643 |
| 11.428571 | -0.13825933 |
| 11.619048 | -0.13732993 |
| 11.809524 | -0.13637313 |
| 12 | -0.13544097 |
| 12.190476 | -0.13454049 |
| 12.380952 | -0.13362596 |
| 12.571429 | -0.13267463 |
| 12.761905 | -0.13172976 |
| 12.952381 | -0.1308344 |
| 13.142857 | -0.12993904 |
| 13.333333 | -0.12900237 |
| 13.52381 | -0.12805657 |
| 13.714286 | -0.12713983 |
| 13.904762 | -0.12624965 |
| 14.095238 | -0.12535529 |
| 14.285714 | -0.12441465 |
| 14.47619 | -0.123474 |
| 14.666667 | -0.12256886 |
| 14.857143 | -0.12168348 |
| 15.047619 | -0.12079559 |
| 15.238095 | -0.11985941 |
| 15.428571 | -0.11892323 |
| 15.619048 | -0.11801214 |
| 15.809524 | -0.11713092 |
| 16 | -0.11624969 |
| 16.190476 | -0.11533241 |
| 16.380952 | -0.11439976 |
| 16.571429 | -0.11346712 |
| 16.761905 | -0.11258619 |
| 16.952381 | -0.11170824 |
| 17.142857 | -0.11082934 |
| 17.333333 | -0.10989908 |
| 17.52381 | -0.10896882 |
| 17.714286 | -0.10804346 |
| 17.904762 | -0.10716769 |
| 18.095238 | -0.10629192 |
| 18.285714 | -0.10541614 |
| 18.47619 | -0.10448807 |
| 18.666667 | -0.10355887 |
| 18.857143 | -0.10262968 |
| 19.047619 | -0.10174763 |
| 19.238095 | -0.10087278 |
| 19.428571 | -0.099997932 |
| 19.619048 | -0.099087611 |
| 19.809524 | -0.098149603 |
| 20 | -0.097211595 |
| 20.190476 | -0.096287589 |
| 20.380952 | -0.095404359 |
| 20.571429 | -0.094521128 |
| 20.761905 | -0.093637898 |
| 20.952381 | -0.092693342 |
| 21.142857 | -0.091727528 |
| 21.333333 | -0.090761714 |
| 21.52381 | -0.089808824 |
| 21.714286 | -0.088899312 |
| 21.904762 | -0.0879898 |
| 22.095238 | -0.087080288 |
| 22.285714 | -0.086123451 |
| 22.47619 | -0.085118628 |
| 22.666667 | -0.084113805 |
| 22.857143 | -0.083108982 |
| 23.047619 | -0.082148797 |
| 23.238095 | -0.081202437 |
| 23.428571 | -0.080256077 |
| 23.619048 | -0.079309717 |
| 23.809524 | -0.078287494 |
| 24 | -0.07724592 |
| 24.190476 | -0.076204346 |
| 24.380952 | -0.075162772 |
| 24.571429 | -0.074171388 |
| 24.761905 | -0.073190285 |
| 24.952381 | -0.072209181 |
| 25.142857 | -0.071228077 |
| 25.333333 | -0.07019218 |
| 25.52381 | -0.06912196 |
| 25.714286 | -0.068051739 |
| 25.904762 | -0.066981519 |
| 26.095238 | -0.065936073 |
| 26.285714 | -0.064927836 |
| 26.47619 | -0.063919599 |
| 26.666667 | -0.062911361 |
| 26.857143 | -0.061903124 |
| 27.047619 | -0.060819771 |
| 27.238095 | -0.059729938 |
| 27.428571 | -0.058640105 |
| 27.619048 | -0.057550273 |
| 27.809524 | -0.056488231 |
| 28 | -0.055461347 |
| 28.190476 | -0.054434462 |
| 28.380952 | -0.053407577 |
| 28.571429 | -0.052380693 |
| 28.761905 | -0.051302619 |
| 28.952381 | -0.050200669 |
| 29.142857 | -0.049098718 |
| 29.333333 | -0.047996768 |
| 29.52381 | -0.046894818 |
| 29.714286 | -0.045851395 |
| 29.904762 | -0.0448129 |
| 30.095238 | -0.043774405 |
| 30.285714 | -0.04273591 |
| 30.47619 | -0.041697415 |
| 30.666667 | -0.040598125 |
| 30.857143 | -0.039489326 |
| 31.047619 | -0.038380526 |
| 31.238095 | -0.037271727 |
| 31.428571 | -0.036162928 |
| 31.619048 | -0.03510549 |
| 31.809524 | -0.034060323 |
| 32 | -0.033015157 |
| 32.190476 | -0.031969991 |
| 32.380952 | -0.030924825 |
| 32.571429 | -0.029850585 |
| 32.761905 | -0.028738248 |
| 32.952381 | -0.027625912 |
| 33.142857 | -0.026513575 |
| 33.333333 | -0.025401238 |
| 33.52381 | -0.024292624 |
| 33.714286 | -0.02324388 |
| 33.904762 | -0.022195136 |
| 34.095238 | -0.021146393 |
| 34.285714 | -0.020097649 |
| 34.47619 | -0.019048905 |
| 34.666667 | -0.017977499 |
| 34.857143 | -0.016863577 |
| 35.047619 | -0.015749655 |
| 35.238095 | -0.014635733 |
| 35.428571 | -0.01352181 |
| 35.619048 | -0.012407888 |
| 35.809524 | -0.011334351 |
| 36 | -0.010283842 |
| 36.190476 | -0.0092333318 |
| 36.380952 | -0.008182822 |
| 36.571429 | -0.0071323122 |
| 36.761905 | -0.0060818024 |
| 36.952381 | -0.0050134603 |
| 37.142857 | -0.0039315794 |
| 37.333333 | -0.0028496985 |
| 37.52381 | -0.0017678175 |
| 37.714286 | -0.00068593663 |
| 37.904762 | 0.00039594429 |
| 38.095238 | 0.0014778291 |
| 38.285714 | 0.0025597179 |
| 38.47619 | 0.0036416067 |
| 38.666667 | 0.0047234954 |
| 38.857143 | 0.0058053842 |
| 39.047619 | 0.006887273 |
| 39.238095 | 0.0079557461 |
| 39.428571 | 0.0090065491 |
| 39.619048 | 0.010057352 |
| 39.809524 | 0.011108155 |
| 40 | 0.012158958 |
| 40.190476 | 0.013209761 |
| 40.380952 | 0.014283603 |
| 40.571429 | 0.015397851 |
| 40.761905 | 0.016512099 |
| 40.952381 | 0.017626346 |
| 41.142857 | 0.018740594 |
| 41.333333 | 0.019854842 |
| 41.52381 | 0.020926668 |
| 41.714286 | 0.021975882 |
| 41.904762 | 0.023025096 |
| 42.095238 | 0.024074309 |
| 42.285714 | 0.025123523 |
| 42.47619 | 0.026172737 |
| 42.666667 | 0.02728186 |
| 42.857143 | 0.028394708 |
| 43.047619 | 0.029507555 |
| 43.238095 | 0.030620403 |
| 43.428571 | 0.03173325 |
| 43.619048 | 0.032808053 |
| 43.809524 | 0.033853822 |
| 44 | 0.034899591 |
| 44.190476 | 0.03594536 |
| 44.380952 | 0.036991129 |
| 44.571429 | 0.03804918 |
| 44.761905 | 0.039158629 |
| 44.952381 | 0.040268078 |
| 45.142857 | 0.041377528 |
| 45.333333 | 0.042486977 |
| 45.52381 | 0.043586919 |
| 45.714286 | 0.044626076 |
| 45.904762 | 0.045665234 |
| 46.095238 | 0.046704391 |
| 46.285714 | 0.047743548 |
| 46.47619 | 0.048787637 |
| 46.666667 | 0.0498903 |
| 46.857143 | 0.050992963 |
| 47.047619 | 0.052095626 |
| 47.238095 | 0.05319829 |
| 47.428571 | 0.054277045 |
| 47.619048 | 0.055304546 |
| 47.809524 | 0.056332046 |
| 48 | 0.057359546 |
| 48.190476 | 0.058387046 |
| 48.380952 | 0.05944973 |
| 48.571429 | 0.060540227 |
| 48.761905 | 0.061630724 |
| 48.952381 | 0.062721221 |
| 49.142857 | 0.063805221 |
| 49.333333 | 0.064813907 |
| 49.52381 | 0.065822593 |
| 49.714286 | 0.066831278 |
| 49.904762 | 0.067839964 |
| 50.095238 | 0.068885882 |
| 50.285714 | 0.069956589 |
| 50.47619 | 0.071027297 |
| 50.666667 | 0.072098005 |
| 50.857143 | 0.07313428 |
| 51.047619 | 0.074115588 |
| 51.238095 | 0.075096896 |
| 51.428571 | 0.076078204 |
| 51.619048 | 0.077069796 |
| 51.809524 | 0.078111599 |
| 52 | 0.079153402 |
| 52.190476 | 0.080195204 |
| 52.380952 | 0.081217618 |
| 52.571429 | 0.082164021 |
| 52.761905 | 0.083110423 |
| 52.952381 | 0.084056825 |
| 53.142857 | 0.085017055 |
| 53.333333 | 0.086021934 |
| 53.52381 | 0.087026814 |
| 53.714286 | 0.088031693 |
| 53.904762 | 0.088988706 |
| 54.095238 | 0.08989851 |
| 54.285714 | 0.090808315 |
| 54.47619 | 0.091718119 |
| 54.666667 | 0.092671324 |
| 54.857143 | 0.093637459 |
| 55.047619 | 0.094603595 |
| 55.238095 | 0.095548782 |
| 55.428571 | 0.096433534 |
| 55.619048 | 0.097318286 |
| 55.809524 | 0.098203038 |
| 56 | 0.099128642 |
| 56.190476 | 0.10006827 |
| 56.380952 | 0.10100791 |
| 56.571429 | 0.10192027 |
| 56.761905 | 0.10279771 |
| 56.952381 | 0.10367514 |
| 57.142857 | 0.1045598 |
| 57.333333 | 0.10549175 |
| 57.52381 | 0.1064237 |
| 57.714286 | 0.10735452 |
| 57.904762 | 0.10823316 |
| 58.095238 | 0.10911179 |
| 58.285714 | 0.10999043 |
| 58.47619 | 0.11091881 |
| 58.666667 | 0.11185211 |
| 58.857143 | 0.11278542 |
| 59.047619 | 0.11366746 |
| 59.238095 | 0.11454857 |
| 59.428571 | 0.11543265 |
| 59.619048 | 0.11636864 |
| 59.809524 | 0.11730463 |
| 60 | 0.11822528 |
| 60.190476 | 0.11910995 |
| 60.380952 | 0.11999461 |
| 60.571429 | 0.12090926 |
| 60.761905 | 0.12184908 |
| 60.952381 | 0.12278891 |
| 61.142857 | 0.12368052 |
| 61.333333 | 0.12456962 |
| 61.52381 | 0.12547858 |
| 61.714286 | 0.12642317 |
| 61.904762 | 0.12736776 |
| 62.095238 | 0.12826611 |
| 62.285714 | 0.1291603 |
| 62.47619 | 0.13008115 |
| 62.666667 | 0.13103119 |
| 62.857143 | 0.1319721 |
| 63.047619 | 0.1328717 |
| 63.238095 | 0.1337713 |
| 63.428571 | 0.13472064 |
| 63.619048 | 0.13567647 |
| 63.809524 | 0.13659545 |
| 64 | 0.13750036 |
| 64.190476 | 0.13843709 |
| 64.380952 | 0.13939859 |
| 64.571429 | 0.14033258 |
| 64.761905 | 0.14124206 |
| 64.952381 | 0.14217971 |
| 65.142857 | 0.14314611 |
| 65.333333 | 0.14408114 |
| 65.52381 | 0.14499358 |
| 65.714286 | 0.14594414 |
| 65.904762 | 0.14691371 |
| 66.095238 | 0.14783381 |
| 66.285714 | 0.14875 |
| 66.47619 | 0.14971962 |
| 66.666667 | 0.15066628 |
| 66.857143 | 0.1515739 |
| 67.047619 | 0.15251992 |
| 67.238095 | 0.15347882 |
| 67.428571 | 0.1543738 |
| 67.619048 | 0.155296 |
| 67.809524 | 0.15624707 |
| 68 | 0.1571186 |
| 68.190476 | 0.15801519 |
| 68.380952 | 0.1589331 |
| 68.571429 | 0.15976012 |
| 68.761905 | 0.16062125 |
| 68.952381 | 0.16145982 |
| 69.142857 | 0.16221593 |
| 69.333333 | 0.16301944 |
| 69.52381 | 0.16370419 |
| 69.714286 | 0.16436904 |
| 69.904762 | 0.16498749 |
| 70.095238 | 0.16546807 |
| 70.285714 | 0.16596492 |
| 70.47619 | 0.16619665 |
| 70.666667 | 0.16644197 |
| 70.857143 | 0.1663763 |
| 71.047619 | 0.16626414 |
| 71.238095 | 0.16577542 |
| 71.428571 | 0.16519547 |
| 71.619048 | 0.1641207 |
| 71.809524 | 0.16286523 |
| 72 | 0.16110699 |
| 72.190476 | 0.1589953 |
| 72.380952 | 0.15647918 |
| 72.571429 | 0.15338177 |
| 72.761905 | 0.14983865 |
| 72.952381 | 0.14581238 |
| 73.142857 | 0.14114918 |
| 73.333333 | 0.13600242 |
| 73.52381 | 0.13025545 |
| 73.714286 | 0.12394219 |
| 73.904762 | 0.11705065 |
| 74.095238 | 0.10956843 |
| 74.285714 | 0.10148936 |
| 74.47619 | 0.09281222 |
| 74.666667 | 0.083539753 |
| 74.857143 | 0.073591074 |
| 75.047619 | 0.06298892 |
| 75.238095 | 0.051818491 |
| 75.428571 | 0.039887586 |
| 75.619048 | 0.027288248 |
| 75.809524 | 0.014020853 |
| 76 | 1.3589325e-14 |
Data tables, one per series (47 points, 4 points, 400 points)
| x from the cold wall (mm) | Experiment (Betts and Bokhari) |
|---|---|
| 0.33 | 15.13 |
| 0.58 | 15.38 |
| 0.84 | 15.65 |
| 1.09 | 15.82 |
| 1.6 | 16.29 |
| 2.11 | 16.72 |
| 2.61 | 17.15 |
| 3.25 | 17.44 |
| 3.88 | 17.79 |
| 5.15 | 18.37 |
| 6.42 | 18.72 |
| 7.69 | 19.04 |
| 8.96 | 19.14 |
| 10.23 | 19.57 |
| 11.5 | 19.62 |
| 12.77 | 19.8 |
| 15.31 | 20.02 |
| 17.85 | 20.23 |
| 20.39 | 20.46 |
| 22.93 | 20.48 |
| 25.47 | 20.48 |
| 28.01 | 20.67 |
| 30.55 | 20.69 |
| 33.09 | 20.71 |
| 35.63 | 20.87 |
| 38.17 | 20.79 |
| 43.11 | 20.73 |
| 48.19 | 20.87 |
| 53.27 | 20.93 |
| 58.35 | 21.25 |
| 60.89 | 21.29 |
| 63.43 | 21.72 |
| 64.7 | 21.77 |
| 65.97 | 22.52 |
| 67.24 | 23.09 |
| 68.51 | 23.87 |
| 69.78 | 24.99 |
| 71.05 | 26.42 |
| 72.32 | 28.32 |
| 72.95 | 29.14 |
| 73.59 | 30.1 |
| 74.09 | 31.15 |
| 74.6 | 32.06 |
| 75.11 | 33.15 |
| 75.36 | 33.52 |
| 75.62 | 33.99 |
| 75.87 | 34.6 |
| x from the cold wall (mm) | Experiment, as published, suspect (4 points) |
|---|---|
| 40.57 | 24.66 |
| 45.65 | 25.36 |
| 50.73 | 25.62 |
| 55.81 | 26.09 |
| x from the cold wall (mm) | Simulation, finest grid |
|---|---|
| 0 | 15 |
| 0.19047619 | 15.1138 |
| 0.38095238 | 15.22693 |
| 0.57142857 | 15.34004 |
| 0.76190476 | 15.45313 |
| 0.95238095 | 15.56619 |
| 1.1428571 | 15.67919 |
| 1.3333333 | 15.79212 |
| 1.5238095 | 15.90493 |
| 1.7142857 | 16.0176 |
| 1.9047619 | 16.13008 |
| 2.0952381 | 16.24233 |
| 2.2857143 | 16.35428 |
| 2.4761905 | 16.46589 |
| 2.6666667 | 16.57708 |
| 2.8571429 | 16.68763 |
| 3.047619 | 16.79753 |
| 3.2380952 | 16.90677 |
| 3.4285714 | 17.01521 |
| 3.6190476 | 17.12225 |
| 3.8095238 | 17.2284 |
| 4 | 17.33316 |
| 4.1904762 | 17.43601 |
| 4.3809524 | 17.53806 |
| 4.5714286 | 17.63672 |
| 4.7619048 | 17.73473 |
| 4.952381 | 17.82888 |
| 5.1428571 | 17.92217 |
| 5.3333333 | 18.01095 |
| 5.5238095 | 18.09927 |
| 5.7142857 | 18.18175 |
| 5.9047619 | 18.26424 |
| 6.0952381 | 18.3407 |
| 6.2857143 | 18.41616 |
| 6.4761905 | 18.48787 |
| 6.6666667 | 18.55587 |
| 6.8571429 | 18.62386 |
| 7.047619 | 18.68433 |
| 7.2380952 | 18.7448 |
| 7.4285714 | 18.80279 |
| 7.6190476 | 18.85601 |
| 7.8095238 | 18.90923 |
| 8 | 18.95899 |
| 8.1904762 | 19.0055 |
| 8.3809524 | 19.052 |
| 8.5714286 | 19.0954 |
| 8.7619048 | 19.13587 |
| 8.952381 | 19.17633 |
| 9.1428571 | 19.21506 |
| 9.3333333 | 19.25019 |
| 9.5238095 | 19.28532 |
| 9.7142857 | 19.32045 |
| 9.9047619 | 19.35124 |
| 10.095238 | 19.38172 |
| 10.285714 | 19.4122 |
| 10.47619 | 19.44134 |
| 10.666667 | 19.46779 |
| 10.857143 | 19.49425 |
| 11.047619 | 19.5207 |
| 11.238095 | 19.54539 |
| 11.428571 | 19.56836 |
| 11.619048 | 19.59133 |
| 11.809524 | 19.6143 |
| 12 | 19.63595 |
| 12.190476 | 19.65591 |
| 12.380952 | 19.67587 |
| 12.571429 | 19.69582 |
| 12.761905 | 19.71548 |
| 12.952381 | 19.73282 |
| 13.142857 | 19.75016 |
| 13.333333 | 19.7675 |
| 13.52381 | 19.78484 |
| 13.714286 | 19.80098 |
| 13.904762 | 19.81604 |
| 14.095238 | 19.8311 |
| 14.285714 | 19.84616 |
| 14.47619 | 19.86122 |
| 14.666667 | 19.875 |
| 14.857143 | 19.88807 |
| 15.047619 | 19.90113 |
| 15.238095 | 19.91419 |
| 15.428571 | 19.92726 |
| 15.619048 | 19.93952 |
| 15.809524 | 19.95083 |
| 16 | 19.96214 |
| 16.190476 | 19.97345 |
| 16.380952 | 19.98475 |
| 16.571429 | 19.99606 |
| 16.761905 | 20.0059 |
| 16.952381 | 20.01566 |
| 17.142857 | 20.02542 |
| 17.333333 | 20.03517 |
| 17.52381 | 20.04493 |
| 17.714286 | 20.05456 |
| 17.904762 | 20.06294 |
| 18.095238 | 20.07132 |
| 18.285714 | 20.0797 |
| 18.47619 | 20.08807 |
| 18.666667 | 20.09645 |
| 18.857143 | 20.10483 |
| 19.047619 | 20.11214 |
| 19.238095 | 20.11929 |
| 19.428571 | 20.12644 |
| 19.619048 | 20.13359 |
| 19.809524 | 20.14074 |
| 20 | 20.14789 |
| 20.190476 | 20.15476 |
| 20.380952 | 20.1608 |
| 20.571429 | 20.16685 |
| 20.761905 | 20.1729 |
| 20.952381 | 20.17895 |
| 21.142857 | 20.185 |
| 21.333333 | 20.19105 |
| 21.52381 | 20.19687 |
| 21.714286 | 20.20193 |
| 21.904762 | 20.207 |
| 22.095238 | 20.21206 |
| 22.285714 | 20.21712 |
| 22.47619 | 20.22218 |
| 22.666667 | 20.22725 |
| 22.857143 | 20.23231 |
| 23.047619 | 20.23669 |
| 23.238095 | 20.24087 |
| 23.428571 | 20.24504 |
| 23.619048 | 20.24922 |
| 23.809524 | 20.25339 |
| 24 | 20.25757 |
| 24.190476 | 20.26174 |
| 24.380952 | 20.26592 |
| 24.571429 | 20.26943 |
| 24.761905 | 20.27281 |
| 24.952381 | 20.27619 |
| 25.142857 | 20.27956 |
| 25.333333 | 20.28294 |
| 25.52381 | 20.28632 |
| 25.714286 | 20.2897 |
| 25.904762 | 20.29307 |
| 26.095238 | 20.29616 |
| 26.285714 | 20.29883 |
| 26.47619 | 20.30149 |
| 26.666667 | 20.30415 |
| 26.857143 | 20.30681 |
| 27.047619 | 20.30948 |
| 27.238095 | 20.31214 |
| 27.428571 | 20.3148 |
| 27.619048 | 20.31746 |
| 27.809524 | 20.31984 |
| 28 | 20.32187 |
| 28.190476 | 20.32389 |
| 28.380952 | 20.32592 |
| 28.571429 | 20.32794 |
| 28.761905 | 20.32997 |
| 28.952381 | 20.33199 |
| 29.142857 | 20.33402 |
| 29.333333 | 20.33604 |
| 29.52381 | 20.33807 |
| 29.714286 | 20.33957 |
| 29.904762 | 20.34103 |
| 30.095238 | 20.3425 |
| 30.285714 | 20.34396 |
| 30.47619 | 20.34542 |
| 30.666667 | 20.34688 |
| 30.857143 | 20.34834 |
| 31.047619 | 20.34981 |
| 31.238095 | 20.35127 |
| 31.428571 | 20.35273 |
| 31.619048 | 20.3538 |
| 31.809524 | 20.35478 |
| 32 | 20.35575 |
| 32.190476 | 20.35673 |
| 32.380952 | 20.3577 |
| 32.571429 | 20.35868 |
| 32.761905 | 20.35966 |
| 32.952381 | 20.36063 |
| 33.142857 | 20.36161 |
| 33.333333 | 20.36258 |
| 33.52381 | 20.36354 |
| 33.714286 | 20.36411 |
| 33.904762 | 20.36468 |
| 34.095238 | 20.36525 |
| 34.285714 | 20.36582 |
| 34.47619 | 20.36639 |
| 34.666667 | 20.36696 |
| 34.857143 | 20.36753 |
| 35.047619 | 20.3681 |
| 35.238095 | 20.36867 |
| 35.428571 | 20.36924 |
| 35.619048 | 20.36981 |
| 35.809524 | 20.37018 |
| 36 | 20.37043 |
| 36.190476 | 20.37069 |
| 36.380952 | 20.37094 |
| 36.571429 | 20.37119 |
| 36.761905 | 20.37145 |
| 36.952381 | 20.3717 |
| 37.142857 | 20.37196 |
| 37.333333 | 20.37221 |
| 37.52381 | 20.37246 |
| 37.714286 | 20.37272 |
| 37.904762 | 20.37297 |
| 38.095238 | 20.37313 |
| 38.285714 | 20.37318 |
| 38.47619 | 20.37324 |
| 38.666667 | 20.37329 |
| 38.857143 | 20.37335 |
| 39.047619 | 20.3734 |
| 39.238095 | 20.37346 |
| 39.428571 | 20.37351 |
| 39.619048 | 20.37357 |
| 39.809524 | 20.37362 |
| 40 | 20.37368 |
| 40.190476 | 20.37373 |
| 40.380952 | 20.37376 |
| 40.571429 | 20.37374 |
| 40.761905 | 20.37371 |
| 40.952381 | 20.37369 |
| 41.142857 | 20.37367 |
| 41.333333 | 20.37365 |
| 41.52381 | 20.37362 |
| 41.714286 | 20.3736 |
| 41.904762 | 20.37358 |
| 42.095238 | 20.37355 |
| 42.285714 | 20.37353 |
| 42.47619 | 20.37351 |
| 42.666667 | 20.37353 |
| 42.857143 | 20.37355 |
| 43.047619 | 20.37357 |
| 43.238095 | 20.37359 |
| 43.428571 | 20.37361 |
| 43.619048 | 20.37364 |
| 43.809524 | 20.37366 |
| 44 | 20.37368 |
| 44.190476 | 20.3737 |
| 44.380952 | 20.37372 |
| 44.571429 | 20.37377 |
| 44.761905 | 20.37396 |
| 44.952381 | 20.37415 |
| 45.142857 | 20.37434 |
| 45.333333 | 20.37453 |
| 45.52381 | 20.37471 |
| 45.714286 | 20.3749 |
| 45.904762 | 20.37509 |
| 46.095238 | 20.37528 |
| 46.285714 | 20.37546 |
| 46.47619 | 20.37567 |
| 46.666667 | 20.37616 |
| 46.857143 | 20.37664 |
| 47.047619 | 20.37712 |
| 47.238095 | 20.37761 |
| 47.428571 | 20.37809 |
| 47.619048 | 20.37857 |
| 47.809524 | 20.37906 |
| 48 | 20.37954 |
| 48.190476 | 20.38002 |
| 48.380952 | 20.38075 |
| 48.571429 | 20.38167 |
| 48.761905 | 20.38259 |
| 48.952381 | 20.38351 |
| 49.142857 | 20.38443 |
| 49.333333 | 20.38535 |
| 49.52381 | 20.38627 |
| 49.714286 | 20.38719 |
| 49.904762 | 20.38811 |
| 50.095238 | 20.38939 |
| 50.285714 | 20.3909 |
| 50.47619 | 20.39242 |
| 50.666667 | 20.39393 |
| 50.857143 | 20.39544 |
| 51.047619 | 20.39696 |
| 51.238095 | 20.39847 |
| 51.428571 | 20.39999 |
| 51.619048 | 20.40163 |
| 51.809524 | 20.40394 |
| 52 | 20.40624 |
| 52.190476 | 20.40854 |
| 52.380952 | 20.41085 |
| 52.571429 | 20.41315 |
| 52.761905 | 20.41545 |
| 52.952381 | 20.41776 |
| 53.142857 | 20.42031 |
| 53.333333 | 20.42368 |
| 53.52381 | 20.42705 |
| 53.714286 | 20.43041 |
| 53.904762 | 20.43378 |
| 54.095238 | 20.43715 |
| 54.285714 | 20.44051 |
| 54.47619 | 20.44388 |
| 54.666667 | 20.44836 |
| 54.857143 | 20.45318 |
| 55.047619 | 20.458 |
| 55.238095 | 20.46281 |
| 55.428571 | 20.46763 |
| 55.619048 | 20.47245 |
| 55.809524 | 20.47726 |
| 56 | 20.48355 |
| 56.190476 | 20.49033 |
| 56.380952 | 20.49711 |
| 56.571429 | 20.5039 |
| 56.761905 | 20.51068 |
| 56.952381 | 20.51746 |
| 57.142857 | 20.5246 |
| 57.333333 | 20.53401 |
| 57.52381 | 20.54343 |
| 57.714286 | 20.55284 |
| 57.904762 | 20.56226 |
| 58.095238 | 20.57168 |
| 58.285714 | 20.58109 |
| 58.47619 | 20.59366 |
| 58.666667 | 20.60654 |
| 58.857143 | 20.61942 |
| 59.047619 | 20.6323 |
| 59.238095 | 20.64518 |
| 59.428571 | 20.6583 |
| 59.619048 | 20.67564 |
| 59.809524 | 20.69297 |
| 60 | 20.71031 |
| 60.190476 | 20.72765 |
| 60.380952 | 20.74499 |
| 60.571429 | 20.76538 |
| 60.761905 | 20.78832 |
| 60.952381 | 20.81127 |
| 61.142857 | 20.83422 |
| 61.333333 | 20.85716 |
| 61.52381 | 20.88257 |
| 61.714286 | 20.9124 |
| 61.904762 | 20.94222 |
| 62.095238 | 20.97205 |
| 62.285714 | 21.00187 |
| 62.47619 | 21.03563 |
| 62.666667 | 21.07369 |
| 62.857143 | 21.11175 |
| 63.047619 | 21.1498 |
| 63.238095 | 21.18786 |
| 63.428571 | 21.23443 |
| 63.619048 | 21.2821 |
| 63.809524 | 21.32978 |
| 64 | 21.37746 |
| 64.190476 | 21.43131 |
| 64.380952 | 21.48996 |
| 64.571429 | 21.54862 |
| 64.761905 | 21.60728 |
| 64.952381 | 21.672 |
| 65.142857 | 21.74291 |
| 65.333333 | 21.81383 |
| 65.52381 | 21.88474 |
| 65.714286 | 21.96459 |
| 65.904762 | 22.04889 |
| 66.095238 | 22.13319 |
| 66.285714 | 22.21841 |
| 66.47619 | 22.31699 |
| 66.666667 | 22.41556 |
| 66.857143 | 22.51413 |
| 67.047619 | 22.62273 |
| 67.238095 | 22.73615 |
| 67.428571 | 22.84958 |
| 67.619048 | 22.97029 |
| 67.809524 | 23.09873 |
| 68 | 23.22717 |
| 68.190476 | 23.36276 |
| 68.380952 | 23.50601 |
| 68.571429 | 23.64925 |
| 68.761905 | 23.80248 |
| 68.952381 | 23.9609 |
| 69.142857 | 24.11931 |
| 69.333333 | 24.29511 |
| 69.52381 | 24.47092 |
| 69.714286 | 24.65679 |
| 69.904762 | 24.85285 |
| 70.095238 | 25.05196 |
| 70.285714 | 25.26949 |
| 70.47619 | 25.48702 |
| 70.666667 | 25.72406 |
| 70.857143 | 25.96265 |
| 71.047619 | 26.21775 |
| 71.238095 | 26.47597 |
| 71.428571 | 26.74944 |
| 71.619048 | 27.02549 |
| 71.809524 | 27.3157 |
| 72 | 27.60941 |
| 72.190476 | 27.91152 |
| 72.380952 | 28.21986 |
| 72.571429 | 28.53229 |
| 72.761905 | 28.85124 |
| 72.952381 | 29.17405 |
| 73.142857 | 29.50013 |
| 73.333333 | 29.82938 |
| 73.52381 | 30.16202 |
| 73.714286 | 30.49686 |
| 73.904762 | 30.83361 |
| 74.095238 | 31.17201 |
| 74.285714 | 31.51179 |
| 74.47619 | 31.85267 |
| 74.666667 | 32.19442 |
| 74.857143 | 32.5369 |
| 75.047619 | 32.87988 |
| 75.238095 | 33.22319 |
| 75.428571 | 33.56675 |
| 75.619048 | 33.91044 |
| 75.809524 | 34.25419 |
| 76 | 34.6 |
Data tables, one per series (30 points, 400 points)
| x from the cold wall (mm) | Experiment (Betts and Bokhari) |
|---|---|
| 1.5 | -0.049 |
| 3.5 | -0.086 |
| 5.5 | -0.095 |
| 7.5 | -0.101 |
| 9.5 | -0.098 |
| 10.5 | -0.096 |
| 12.5 | -0.087 |
| 14.5 | -0.081 |
| 16.5 | -0.078 |
| 18.5 | -0.07 |
| 20.5 | -0.064 |
| 25.5 | -0.052 |
| 30.5 | -0.044 |
| 35.5 | -0.028 |
| 38.2 | -0.019 |
| 43.2 | -0.011 |
| 48.2 | 0.003 |
| 53.2 | 0.023 |
| 58.2 | 0.038 |
| 60.2 | 0.055 |
| 62.2 | 0.07 |
| 64.2 | 0.09 |
| 66.2 | 0.121 |
| 68.2 | 0.151 |
| 69.2 | 0.168 |
| 70.2 | 0.18 |
| 71.2 | 0.19 |
| 72.2 | 0.192 |
| 73.2 | 0.193 |
| 74.2 | 0.16 |
| x from the cold wall (mm) | Simulation, finest grid |
|---|---|
| 0 | 0 |
| 0.19047619 | -0.0083134831 |
| 0.38095238 | -0.016200619 |
| 0.57142857 | -0.023717271 |
| 0.76190476 | -0.030877057 |
| 0.95238095 | -0.037655682 |
| 1.1428571 | -0.044108373 |
| 1.3333333 | -0.050219162 |
| 1.5238095 | -0.05597451 |
| 1.7142857 | -0.061410779 |
| 1.9047619 | -0.066530121 |
| 2.0952381 | -0.071337537 |
| 2.2857143 | -0.075841262 |
| 2.4761905 | -0.080053175 |
| 2.6666667 | -0.083980196 |
| 2.8571429 | -0.087554363 |
| 3.047619 | -0.09085976 |
| 3.2380952 | -0.093922052 |
| 3.4285714 | -0.096724199 |
| 3.6190476 | -0.099175147 |
| 3.8095238 | -0.10143956 |
| 4 | -0.10343608 |
| 4.1904762 | -0.1051431 |
| 4.3809524 | -0.10672955 |
| 4.5714286 | -0.10792311 |
| 4.7619048 | -0.10905624 |
| 4.952381 | -0.10984542 |
| 5.1428571 | -0.11057673 |
| 5.3333333 | -0.11100157 |
| 5.5238095 | -0.11140257 |
| 5.7142857 | -0.11150342 |
| 5.9047619 | -0.11160427 |
| 6.0952381 | -0.11147077 |
| 6.2857143 | -0.11129837 |
| 6.4761905 | -0.11101684 |
| 6.6666667 | -0.11062749 |
| 6.8571429 | -0.11023798 |
| 7.047619 | -0.10968728 |
| 7.2380952 | -0.10913659 |
| 7.4285714 | -0.10854745 |
| 7.6190476 | -0.10788442 |
| 7.8095238 | -0.10722139 |
| 8 | -0.10652078 |
| 8.1904762 | -0.10578507 |
| 8.3809524 | -0.10504935 |
| 8.5714286 | -0.10429161 |
| 8.7619048 | -0.10351312 |
| 8.952381 | -0.10273463 |
| 9.1428571 | -0.10194921 |
| 9.3333333 | -0.10114935 |
| 9.5238095 | -0.10034949 |
| 9.7142857 | -0.09954963 |
| 9.9047619 | -0.098743573 |
| 10.095238 | -0.097937085 |
| 10.285714 | -0.097130596 |
| 10.47619 | -0.096325184 |
| 10.666667 | -0.095521929 |
| 10.857143 | -0.094718675 |
| 11.047619 | -0.093915421 |
| 11.238095 | -0.093117056 |
| 11.428571 | -0.092323485 |
| 11.619048 | -0.091529914 |
| 11.809524 | -0.090736343 |
| 12 | -0.089948812 |
| 12.190476 | -0.089169045 |
| 12.380952 | -0.088389279 |
| 12.571429 | -0.087609512 |
| 12.761905 | -0.086831634 |
| 12.952381 | -0.086068232 |
| 13.142857 | -0.08530483 |
| 13.333333 | -0.084541428 |
| 13.52381 | -0.083778026 |
| 13.714286 | -0.083023975 |
| 13.904762 | -0.082278462 |
| 14.095238 | -0.08153295 |
| 14.285714 | -0.080787438 |
| 14.47619 | -0.080041925 |
| 14.666667 | -0.079308447 |
| 14.857143 | -0.07858167 |
| 15.047619 | -0.077854892 |
| 15.238095 | -0.077128115 |
| 15.428571 | -0.076401337 |
| 15.619048 | -0.075683294 |
| 15.809524 | -0.074975654 |
| 16 | -0.074268013 |
| 16.190476 | -0.073560372 |
| 16.380952 | -0.072852732 |
| 16.571429 | -0.072145091 |
| 16.761905 | -0.07145566 |
| 16.952381 | -0.070767272 |
| 17.142857 | -0.070078885 |
| 17.333333 | -0.069390498 |
| 17.52381 | -0.068702111 |
| 17.714286 | -0.068015451 |
| 17.904762 | -0.067346253 |
| 18.095238 | -0.066677054 |
| 18.285714 | -0.066007855 |
| 18.47619 | -0.065338657 |
| 18.666667 | -0.064669458 |
| 18.857143 | -0.06400026 |
| 19.047619 | -0.063347555 |
| 19.238095 | -0.062697367 |
| 19.428571 | -0.062047179 |
| 19.619048 | -0.06139699 |
| 19.809524 | -0.060746802 |
| 20 | -0.060096614 |
| 20.190476 | -0.059451221 |
| 20.380952 | -0.058819793 |
| 20.571429 | -0.058188366 |
| 20.761905 | -0.057556939 |
| 20.952381 | -0.056925511 |
| 21.142857 | -0.056294084 |
| 21.333333 | -0.055662656 |
| 21.52381 | -0.055035468 |
| 21.714286 | -0.054422506 |
| 21.904762 | -0.053809543 |
| 22.095238 | -0.053196581 |
| 22.285714 | -0.052583619 |
| 22.47619 | -0.051970657 |
| 22.666667 | -0.051357695 |
| 22.857143 | -0.050744733 |
| 23.047619 | -0.050145617 |
| 23.238095 | -0.049550789 |
| 23.428571 | -0.048955961 |
| 23.619048 | -0.048361133 |
| 23.809524 | -0.047766305 |
| 24 | -0.047171477 |
| 24.190476 | -0.046576648 |
| 24.380952 | -0.04598182 |
| 24.571429 | -0.045401738 |
| 24.761905 | -0.044824677 |
| 24.952381 | -0.044247615 |
| 25.142857 | -0.043670553 |
| 25.333333 | -0.043093491 |
| 25.52381 | -0.042516429 |
| 25.714286 | -0.041939367 |
| 25.904762 | -0.041362305 |
| 26.095238 | -0.040792177 |
| 26.285714 | -0.040232463 |
| 26.47619 | -0.039672749 |
| 26.666667 | -0.039113034 |
| 26.857143 | -0.03855332 |
| 27.047619 | -0.037993605 |
| 27.238095 | -0.037433891 |
| 27.428571 | -0.036874177 |
| 27.619048 | -0.036314462 |
| 27.809524 | -0.035762189 |
| 28 | -0.03521933 |
| 28.190476 | -0.03467647 |
| 28.380952 | -0.034133611 |
| 28.571429 | -0.033590752 |
| 28.761905 | -0.033047892 |
| 28.952381 | -0.032505033 |
| 29.142857 | -0.031962173 |
| 29.333333 | -0.031419314 |
| 29.52381 | -0.030876455 |
| 29.714286 | -0.030348588 |
| 29.904762 | -0.029821984 |
| 30.095238 | -0.029295379 |
| 30.285714 | -0.028768775 |
| 30.47619 | -0.02824217 |
| 30.666667 | -0.027715566 |
| 30.857143 | -0.027188962 |
| 31.047619 | -0.026662357 |
| 31.238095 | -0.026135753 |
| 31.428571 | -0.025609148 |
| 31.619048 | -0.025095033 |
| 31.809524 | -0.024583902 |
| 32 | -0.02407277 |
| 32.190476 | -0.023561639 |
| 32.380952 | -0.023050508 |
| 32.571429 | -0.022539376 |
| 32.761905 | -0.022028245 |
| 32.952381 | -0.021517114 |
| 33.142857 | -0.021005983 |
| 33.333333 | -0.020494851 |
| 33.52381 | -0.01998456 |
| 33.714286 | -0.01948777 |
| 33.904762 | -0.01899098 |
| 34.095238 | -0.018494191 |
| 34.285714 | -0.017997401 |
| 34.47619 | -0.017500612 |
| 34.666667 | -0.017003822 |
| 34.857143 | -0.016507033 |
| 35.047619 | -0.016010243 |
| 35.238095 | -0.015513453 |
| 35.428571 | -0.015016664 |
| 35.619048 | -0.014519874 |
| 35.809524 | -0.014035704 |
| 36 | -0.01355873 |
| 36.190476 | -0.013081756 |
| 36.380952 | -0.012604782 |
| 36.571429 | -0.012127807 |
| 36.761905 | -0.011650833 |
| 36.952381 | -0.011173859 |
| 37.142857 | -0.010696884 |
| 37.333333 | -0.01021991 |
| 37.52381 | -0.0097429359 |
| 37.714286 | -0.0092659616 |
| 37.904762 | -0.0087889874 |
| 38.095238 | -0.008316811 |
| 38.285714 | -0.0078494325 |
| 38.47619 | -0.0073820539 |
| 38.666667 | -0.0069146754 |
| 38.857143 | -0.0064472969 |
| 39.047619 | -0.0059799184 |
| 39.238095 | -0.0055125399 |
| 39.428571 | -0.0050451614 |
| 39.619048 | -0.0045777829 |
| 39.809524 | -0.0041104044 |
| 40 | -0.0036430259 |
| 40.190476 | -0.0031756474 |
| 40.380952 | -0.002710411 |
| 40.571429 | -0.0022489315 |
| 40.761905 | -0.0017874521 |
| 40.952381 | -0.0013259726 |
| 41.142857 | -0.00086449312 |
| 41.333333 | -0.00040301365 |
| 41.52381 | 0.000058465826 |
| 41.714286 | 0.0005199453 |
| 41.904762 | 0.00098142477 |
| 42.095238 | 0.0014429042 |
| 42.285714 | 0.0019043837 |
| 42.47619 | 0.0023658632 |
| 42.666667 | 0.0028249171 |
| 42.857143 | 0.0032838202 |
| 43.047619 | 0.0037427233 |
| 43.238095 | 0.0042016265 |
| 43.428571 | 0.0046605296 |
| 43.619048 | 0.0051194327 |
| 43.809524 | 0.0055783358 |
| 44 | 0.0060372389 |
| 44.190476 | 0.006496142 |
| 44.380952 | 0.0069550452 |
| 44.571429 | 0.0074158355 |
| 44.761905 | 0.0078845237 |
| 44.952381 | 0.008353212 |
| 45.142857 | 0.0088219002 |
| 45.333333 | 0.0092905884 |
| 45.52381 | 0.0097592767 |
| 45.714286 | 0.010227965 |
| 45.904762 | 0.010696653 |
| 46.095238 | 0.011165341 |
| 46.285714 | 0.01163403 |
| 46.47619 | 0.012103312 |
| 46.666667 | 0.012579652 |
| 46.857143 | 0.013055992 |
| 47.047619 | 0.013532332 |
| 47.238095 | 0.014008672 |
| 47.428571 | 0.014485012 |
| 47.619048 | 0.014961352 |
| 47.809524 | 0.015437691 |
| 48 | 0.015914031 |
| 48.190476 | 0.016390371 |
| 48.380952 | 0.01687395 |
| 48.571429 | 0.017363252 |
| 48.761905 | 0.017852554 |
| 48.952381 | 0.018341856 |
| 49.142857 | 0.018831158 |
| 49.333333 | 0.01932046 |
| 49.52381 | 0.019809762 |
| 49.714286 | 0.020299063 |
| 49.904762 | 0.020788365 |
| 50.095238 | 0.021288933 |
| 50.285714 | 0.021797003 |
| 50.47619 | 0.022305072 |
| 50.666667 | 0.022813141 |
| 50.857143 | 0.023321211 |
| 51.047619 | 0.02382928 |
| 51.238095 | 0.024337349 |
| 51.428571 | 0.024845419 |
| 51.619048 | 0.025358127 |
| 51.809524 | 0.025893481 |
| 52 | 0.026428835 |
| 52.190476 | 0.02696419 |
| 52.380952 | 0.027499544 |
| 52.571429 | 0.028034899 |
| 52.761905 | 0.028570253 |
| 52.952381 | 0.029105608 |
| 53.142857 | 0.029650848 |
| 53.333333 | 0.030228007 |
| 53.52381 | 0.030805167 |
| 53.714286 | 0.031382326 |
| 53.904762 | 0.031959486 |
| 54.095238 | 0.032536645 |
| 54.285714 | 0.033113805 |
| 54.47619 | 0.033690964 |
| 54.666667 | 0.034315406 |
| 54.857143 | 0.034953934 |
| 55.047619 | 0.035592463 |
| 55.238095 | 0.036230992 |
| 55.428571 | 0.036869521 |
| 55.619048 | 0.03750805 |
| 55.809524 | 0.038146579 |
| 56 | 0.038846856 |
| 56.190476 | 0.039568338 |
| 56.380952 | 0.040289819 |
| 56.571429 | 0.041011301 |
| 56.761905 | 0.041732782 |
| 56.952381 | 0.042454264 |
| 57.142857 | 0.04318974 |
| 57.333333 | 0.04401696 |
| 57.52381 | 0.04484418 |
| 57.714286 | 0.0456714 |
| 57.904762 | 0.046498619 |
| 58.095238 | 0.047325839 |
| 58.285714 | 0.048153059 |
| 58.47619 | 0.049098052 |
| 58.666667 | 0.050054699 |
| 58.857143 | 0.051011346 |
| 59.047619 | 0.051967993 |
| 59.238095 | 0.052924641 |
| 59.428571 | 0.053889585 |
| 59.619048 | 0.054999229 |
| 59.809524 | 0.056108873 |
| 60 | 0.057218518 |
| 60.190476 | 0.058328162 |
| 60.380952 | 0.059437806 |
| 60.571429 | 0.060642549 |
| 60.761905 | 0.061927143 |
| 60.952381 | 0.063211737 |
| 61.142857 | 0.064496331 |
| 61.333333 | 0.065780925 |
| 61.52381 | 0.067134736 |
| 61.714286 | 0.068612859 |
| 61.904762 | 0.070090983 |
| 62.095238 | 0.071569107 |
| 62.285714 | 0.073047231 |
| 62.47619 | 0.07462411 |
| 62.666667 | 0.076309128 |
| 62.857143 | 0.077994146 |
| 63.047619 | 0.079679163 |
| 63.238095 | 0.081364181 |
| 63.428571 | 0.083237825 |
| 63.619048 | 0.08513608 |
| 63.809524 | 0.087034335 |
| 64 | 0.088932591 |
| 64.190476 | 0.09094948 |
| 64.380952 | 0.093058647 |
| 64.571429 | 0.095167814 |
| 64.761905 | 0.097276981 |
| 64.952381 | 0.099484377 |
| 65.142857 | 0.10179196 |
| 65.333333 | 0.10409954 |
| 65.52381 | 0.10640712 |
| 65.714286 | 0.10883101 |
| 65.904762 | 0.11131289 |
| 66.095238 | 0.11379476 |
| 66.285714 | 0.11628559 |
| 66.47619 | 0.11890489 |
| 66.666667 | 0.12152419 |
| 66.857143 | 0.12414349 |
| 67.047619 | 0.12682172 |
| 67.238095 | 0.12952828 |
| 67.428571 | 0.13223484 |
| 67.619048 | 0.13495313 |
| 67.809524 | 0.13768388 |
| 68 | 0.14041463 |
| 68.190476 | 0.14312213 |
| 68.380952 | 0.14580474 |
| 68.571429 | 0.14848735 |
| 68.761905 | 0.15109888 |
| 68.952381 | 0.15367343 |
| 69.142857 | 0.15624798 |
| 69.333333 | 0.15868297 |
| 69.52381 | 0.16111781 |
| 69.714286 | 0.16346307 |
| 69.904762 | 0.16571764 |
| 70.095238 | 0.1679342 |
| 70.285714 | 0.16992176 |
| 70.47619 | 0.17190932 |
| 70.666667 | 0.17353949 |
| 70.857143 | 0.17514128 |
| 71.047619 | 0.17631122 |
| 71.238095 | 0.1773996 |
| 71.428571 | 0.1779293 |
| 71.619048 | 0.1783583 |
| 71.809524 | 0.17807221 |
| 72 | 0.1775455 |
| 72.190476 | 0.17644101 |
| 72.380952 | 0.17476191 |
| 72.571429 | 0.17267707 |
| 72.761905 | 0.16979724 |
| 72.952381 | 0.16630211 |
| 73.142857 | 0.1622221 |
| 73.333333 | 0.15748276 |
| 73.52381 | 0.15185331 |
| 73.714286 | 0.14548797 |
| 73.904762 | 0.13835733 |
| 74.095238 | 0.13041867 |
| 74.285714 | 0.12163907 |
| 74.47619 | 0.11199521 |
| 74.666667 | 0.10147286 |
| 74.857143 | 0.089963564 |
| 75.047619 | 0.077498507 |
| 75.238095 | 0.064117848 |
| 75.428571 | 0.04966249 |
| 75.619048 | 0.034198264 |
| 75.809524 | 0.017685368 |
| 76 | 1.7235025e-14 |
Data tables, one per series (51 points, 400 points)
| x from the cold wall (mm) | Experiment (Betts and Bokhari) |
|---|---|
| 0.33 | 15.61 |
| 0.58 | 16.32 |
| 0.84 | 16.8 |
| 1.09 | 17.38 |
| 1.6 | 18.36 |
| 2.11 | 19.52 |
| 2.61 | 20.39 |
| 3.25 | 21.64 |
| 3.88 | 22.49 |
| 5.15 | 24.23 |
| 6.42 | 25.68 |
| 7.69 | 26.84 |
| 8.96 | 27.48 |
| 10.23 | 28.1 |
| 11.5 | 28.55 |
| 12.77 | 28.97 |
| 15.31 | 29.26 |
| 17.85 | 29.52 |
| 20.39 | 29.53 |
| 22.93 | 29.54 |
| 25.47 | 29.55 |
| 28.01 | 29.6 |
| 30.55 | 29.67 |
| 33.09 | 29.71 |
| 35.63 | 29.74 |
| 38.17 | 29.73 |
| 40.57 | 29.93 |
| 43.11 | 29.99 |
| 45.65 | 30.07 |
| 48.19 | 30.1 |
| 50.73 | 30.12 |
| 53.27 | 30.18 |
| 55.81 | 30.29 |
| 58.35 | 30.4 |
| 60.89 | 30.57 |
| 63.43 | 30.69 |
| 64.7 | 30.85 |
| 65.97 | 31.02 |
| 67.24 | 31.19 |
| 68.51 | 31.48 |
| 69.78 | 31.68 |
| 71.05 | 32.06 |
| 72.32 | 32.52 |
| 72.95 | 32.77 |
| 73.59 | 33.2 |
| 74.09 | 33.49 |
| 74.6 | 33.78 |
| 75.11 | 34.19 |
| 75.36 | 34.38 |
| 75.62 | 34.6 |
| 75.87 | 34.77 |
| x from the cold wall (mm) | Simulation, finest grid |
|---|---|
| 0 | 15 |
| 0.19047619 | 15.3444 |
| 0.38095238 | 15.68674 |
| 0.57142857 | 16.02902 |
| 0.76190476 | 16.37117 |
| 0.95238095 | 16.71305 |
| 1.1428571 | 17.05459 |
| 1.3333333 | 17.39562 |
| 1.5238095 | 17.73588 |
| 1.7142857 | 18.07524 |
| 1.9047619 | 18.41344 |
| 2.0952381 | 18.7502 |
| 2.2857143 | 19.08524 |
| 2.4761905 | 19.41827 |
| 2.6666667 | 19.749 |
| 2.8571429 | 20.07617 |
| 3.047619 | 20.4 |
| 3.2380952 | 20.72039 |
| 3.4285714 | 21.03671 |
| 3.6190476 | 21.34618 |
| 3.8095238 | 21.65134 |
| 4 | 21.94998 |
| 4.1904762 | 22.23984 |
| 4.3809524 | 22.52605 |
| 4.5714286 | 22.79759 |
| 4.7619048 | 23.06648 |
| 4.952381 | 23.31974 |
| 5.1428571 | 23.56984 |
| 5.3333333 | 23.8032 |
| 5.5238095 | 24.03501 |
| 5.7142857 | 24.24727 |
| 5.9047619 | 24.45953 |
| 6.0952381 | 24.65352 |
| 6.2857143 | 24.84447 |
| 6.4761905 | 25.02534 |
| 6.6666667 | 25.19625 |
| 6.8571429 | 25.36715 |
| 7.047619 | 25.52088 |
| 7.2380952 | 25.67461 |
| 7.4285714 | 25.8233 |
| 7.6190476 | 25.9623 |
| 7.8095238 | 26.10129 |
| 8 | 26.23294 |
| 8.1904762 | 26.35773 |
| 8.3809524 | 26.48252 |
| 8.5714286 | 26.59988 |
| 8.7619048 | 26.71025 |
| 8.952381 | 26.82062 |
| 9.1428571 | 26.92636 |
| 9.3333333 | 27.02246 |
| 9.5238095 | 27.11856 |
| 9.7142857 | 27.21466 |
| 9.9047619 | 27.29791 |
| 10.095238 | 27.38027 |
| 10.285714 | 27.46263 |
| 10.47619 | 27.5407 |
| 10.666667 | 27.61016 |
| 10.857143 | 27.67962 |
| 11.047619 | 27.74908 |
| 11.238095 | 27.81257 |
| 11.428571 | 27.87021 |
| 11.619048 | 27.92784 |
| 11.809524 | 27.98548 |
| 12 | 28.03847 |
| 12.190476 | 28.08549 |
| 12.380952 | 28.13251 |
| 12.571429 | 28.17954 |
| 12.761905 | 28.22548 |
| 12.952381 | 28.2632 |
| 13.142857 | 28.30091 |
| 13.333333 | 28.33862 |
| 13.52381 | 28.37633 |
| 13.714286 | 28.40987 |
| 13.904762 | 28.4396 |
| 14.095238 | 28.46932 |
| 14.285714 | 28.49905 |
| 14.47619 | 28.52877 |
| 14.666667 | 28.5542 |
| 14.857143 | 28.57723 |
| 15.047619 | 28.60026 |
| 15.238095 | 28.62329 |
| 15.428571 | 28.64632 |
| 15.619048 | 28.66685 |
| 15.809524 | 28.68441 |
| 16 | 28.70196 |
| 16.190476 | 28.71951 |
| 16.380952 | 28.73706 |
| 16.571429 | 28.75462 |
| 16.761905 | 28.76803 |
| 16.952381 | 28.7812 |
| 17.142857 | 28.79437 |
| 17.333333 | 28.80754 |
| 17.52381 | 28.82071 |
| 17.714286 | 28.83358 |
| 17.904762 | 28.84333 |
| 18.095238 | 28.85307 |
| 18.285714 | 28.86282 |
| 18.47619 | 28.87257 |
| 18.666667 | 28.88232 |
| 18.857143 | 28.89206 |
| 19.047619 | 28.89953 |
| 19.238095 | 28.90665 |
| 19.428571 | 28.91378 |
| 19.619048 | 28.9209 |
| 19.809524 | 28.92802 |
| 20 | 28.93514 |
| 20.190476 | 28.94175 |
| 20.380952 | 28.94689 |
| 20.571429 | 28.95203 |
| 20.761905 | 28.95717 |
| 20.952381 | 28.96231 |
| 21.142857 | 28.96745 |
| 21.333333 | 28.97259 |
| 21.52381 | 28.97739 |
| 21.714286 | 28.98105 |
| 21.904762 | 28.98471 |
| 22.095238 | 28.98837 |
| 22.285714 | 28.99203 |
| 22.47619 | 28.99569 |
| 22.666667 | 28.99935 |
| 22.857143 | 29.00301 |
| 23.047619 | 29.00583 |
| 23.238095 | 29.00839 |
| 23.428571 | 29.01096 |
| 23.619048 | 29.01352 |
| 23.809524 | 29.01609 |
| 24 | 29.01865 |
| 24.190476 | 29.02121 |
| 24.380952 | 29.02378 |
| 24.571429 | 29.02567 |
| 24.761905 | 29.02742 |
| 24.952381 | 29.02917 |
| 25.142857 | 29.03092 |
| 25.333333 | 29.03267 |
| 25.52381 | 29.03442 |
| 25.714286 | 29.03618 |
| 25.904762 | 29.03793 |
| 26.095238 | 29.03944 |
| 26.285714 | 29.04058 |
| 26.47619 | 29.04172 |
| 26.666667 | 29.04286 |
| 26.857143 | 29.04401 |
| 27.047619 | 29.04515 |
| 27.238095 | 29.04629 |
| 27.428571 | 29.04744 |
| 27.619048 | 29.04858 |
| 27.809524 | 29.04953 |
| 28 | 29.05022 |
| 28.190476 | 29.05092 |
| 28.380952 | 29.05161 |
| 28.571429 | 29.05231 |
| 28.761905 | 29.05301 |
| 28.952381 | 29.0537 |
| 29.142857 | 29.0544 |
| 29.333333 | 29.0551 |
| 29.52381 | 29.05579 |
| 29.714286 | 29.05621 |
| 29.904762 | 29.0566 |
| 30.095238 | 29.05699 |
| 30.285714 | 29.05738 |
| 30.47619 | 29.05778 |
| 30.666667 | 29.05817 |
| 30.857143 | 29.05856 |
| 31.047619 | 29.05895 |
| 31.238095 | 29.05934 |
| 31.428571 | 29.05974 |
| 31.619048 | 29.05999 |
| 31.809524 | 29.06021 |
| 32 | 29.06043 |
| 32.190476 | 29.06065 |
| 32.380952 | 29.06087 |
| 32.571429 | 29.06109 |
| 32.761905 | 29.06131 |
| 32.952381 | 29.06152 |
| 33.142857 | 29.06174 |
| 33.333333 | 29.06196 |
| 33.52381 | 29.06218 |
| 33.714286 | 29.06235 |
| 33.904762 | 29.06253 |
| 34.095238 | 29.0627 |
| 34.285714 | 29.06287 |
| 34.47619 | 29.06305 |
| 34.666667 | 29.06322 |
| 34.857143 | 29.06339 |
| 35.047619 | 29.06356 |
| 35.238095 | 29.06374 |
| 35.428571 | 29.06391 |
| 35.619048 | 29.06408 |
| 35.809524 | 29.06431 |
| 36 | 29.06456 |
| 36.190476 | 29.06481 |
| 36.380952 | 29.06506 |
| 36.571429 | 29.06531 |
| 36.761905 | 29.06556 |
| 36.952381 | 29.06581 |
| 37.142857 | 29.06607 |
| 37.333333 | 29.06632 |
| 37.52381 | 29.06657 |
| 37.714286 | 29.06682 |
| 37.904762 | 29.06707 |
| 38.095238 | 29.06743 |
| 38.285714 | 29.06788 |
| 38.47619 | 29.06834 |
| 38.666667 | 29.0688 |
| 38.857143 | 29.06926 |
| 39.047619 | 29.06972 |
| 39.238095 | 29.07017 |
| 39.428571 | 29.07063 |
| 39.619048 | 29.07109 |
| 39.809524 | 29.07155 |
| 40 | 29.07201 |
| 40.190476 | 29.07246 |
| 40.380952 | 29.07304 |
| 40.571429 | 29.07383 |
| 40.761905 | 29.07462 |
| 40.952381 | 29.07541 |
| 41.142857 | 29.0762 |
| 41.333333 | 29.07699 |
| 41.52381 | 29.07778 |
| 41.714286 | 29.07857 |
| 41.904762 | 29.07936 |
| 42.095238 | 29.08015 |
| 42.285714 | 29.08094 |
| 42.47619 | 29.08172 |
| 42.666667 | 29.08291 |
| 42.857143 | 29.08412 |
| 43.047619 | 29.08533 |
| 43.238095 | 29.08654 |
| 43.428571 | 29.08775 |
| 43.619048 | 29.08896 |
| 43.809524 | 29.09017 |
| 44 | 29.09138 |
| 44.190476 | 29.09259 |
| 44.380952 | 29.0938 |
| 44.571429 | 29.09511 |
| 44.761905 | 29.09682 |
| 44.952381 | 29.09854 |
| 45.142857 | 29.10025 |
| 45.333333 | 29.10197 |
| 45.52381 | 29.10368 |
| 45.714286 | 29.10539 |
| 45.904762 | 29.10711 |
| 46.095238 | 29.10882 |
| 46.285714 | 29.11054 |
| 46.47619 | 29.1123 |
| 46.666667 | 29.1146 |
| 46.857143 | 29.1169 |
| 47.047619 | 29.11919 |
| 47.238095 | 29.12149 |
| 47.428571 | 29.12379 |
| 47.619048 | 29.12609 |
| 47.809524 | 29.12839 |
| 48 | 29.13069 |
| 48.190476 | 29.13299 |
| 48.380952 | 29.13566 |
| 48.571429 | 29.13862 |
| 48.761905 | 29.14158 |
| 48.952381 | 29.14454 |
| 49.142857 | 29.1475 |
| 49.333333 | 29.15047 |
| 49.52381 | 29.15343 |
| 49.714286 | 29.15639 |
| 49.904762 | 29.15935 |
| 50.095238 | 29.16276 |
| 50.285714 | 29.16647 |
| 50.47619 | 29.17017 |
| 50.666667 | 29.17388 |
| 50.857143 | 29.17759 |
| 51.047619 | 29.18129 |
| 51.238095 | 29.185 |
| 51.428571 | 29.18871 |
| 51.619048 | 29.19255 |
| 51.809524 | 29.19709 |
| 52 | 29.20163 |
| 52.190476 | 29.20617 |
| 52.380952 | 29.2107 |
| 52.571429 | 29.21524 |
| 52.761905 | 29.21978 |
| 52.952381 | 29.22432 |
| 53.142857 | 29.22907 |
| 53.333333 | 29.23454 |
| 53.52381 | 29.24 |
| 53.714286 | 29.24547 |
| 53.904762 | 29.25093 |
| 54.095238 | 29.2564 |
| 54.285714 | 29.26186 |
| 54.47619 | 29.26732 |
| 54.666667 | 29.27358 |
| 54.857143 | 29.28008 |
| 55.047619 | 29.28658 |
| 55.238095 | 29.29307 |
| 55.428571 | 29.29957 |
| 55.619048 | 29.30606 |
| 55.809524 | 29.31256 |
| 56 | 29.31991 |
| 56.190476 | 29.32756 |
| 56.380952 | 29.33521 |
| 56.571429 | 29.34286 |
| 56.761905 | 29.35051 |
| 56.952381 | 29.35816 |
| 57.142857 | 29.36598 |
| 57.333333 | 29.37492 |
| 57.52381 | 29.38386 |
| 57.714286 | 29.3928 |
| 57.904762 | 29.40173 |
| 58.095238 | 29.41067 |
| 58.285714 | 29.41961 |
| 58.47619 | 29.42987 |
| 58.666667 | 29.44026 |
| 58.857143 | 29.45065 |
| 59.047619 | 29.46104 |
| 59.238095 | 29.47143 |
| 59.428571 | 29.48191 |
| 59.619048 | 29.49393 |
| 59.809524 | 29.50596 |
| 60 | 29.51798 |
| 60.190476 | 29.53001 |
| 60.380952 | 29.54204 |
| 60.571429 | 29.55507 |
| 60.761905 | 29.56895 |
| 60.952381 | 29.58283 |
| 61.142857 | 29.59672 |
| 61.333333 | 29.6106 |
| 61.52381 | 29.62524 |
| 61.714286 | 29.64123 |
| 61.904762 | 29.65723 |
| 62.095238 | 29.67322 |
| 62.285714 | 29.68922 |
| 62.47619 | 29.70637 |
| 62.666667 | 29.72479 |
| 62.857143 | 29.74321 |
| 63.047619 | 29.76163 |
| 63.238095 | 29.78004 |
| 63.428571 | 29.80092 |
| 63.619048 | 29.82213 |
| 63.809524 | 29.84333 |
| 64 | 29.86453 |
| 64.190476 | 29.88754 |
| 64.380952 | 29.91195 |
| 64.571429 | 29.93637 |
| 64.761905 | 29.96078 |
| 64.952381 | 29.98704 |
| 65.142857 | 30.01517 |
| 65.333333 | 30.0433 |
| 65.52381 | 30.07143 |
| 65.714286 | 30.10243 |
| 65.904762 | 30.13485 |
| 66.095238 | 30.16728 |
| 66.285714 | 30.20003 |
| 66.47619 | 30.23741 |
| 66.666667 | 30.27479 |
| 66.857143 | 30.31216 |
| 67.047619 | 30.35336 |
| 67.238095 | 30.39639 |
| 67.428571 | 30.43942 |
| 67.619048 | 30.48553 |
| 67.809524 | 30.53492 |
| 68 | 30.5843 |
| 68.190476 | 30.63706 |
| 68.380952 | 30.69342 |
| 68.571429 | 30.74978 |
| 68.761905 | 30.81102 |
| 68.952381 | 30.87479 |
| 69.142857 | 30.93856 |
| 69.333333 | 31.00986 |
| 69.52381 | 31.08117 |
| 69.714286 | 31.1561 |
| 69.904762 | 31.23472 |
| 70.095238 | 31.31428 |
| 70.285714 | 31.39961 |
| 70.47619 | 31.48494 |
| 70.666667 | 31.57571 |
| 70.857143 | 31.66691 |
| 71.047619 | 31.76224 |
| 71.238095 | 31.85836 |
| 71.428571 | 31.95796 |
| 71.619048 | 32.05814 |
| 71.809524 | 32.16135 |
| 72 | 32.26526 |
| 72.190476 | 32.37087 |
| 72.380952 | 32.47769 |
| 72.571429 | 32.5853 |
| 72.761905 | 32.69413 |
| 72.952381 | 32.80367 |
| 73.142857 | 32.91379 |
| 73.333333 | 33.02446 |
| 73.52381 | 33.13572 |
| 73.714286 | 33.24733 |
| 73.904762 | 33.35925 |
| 74.095238 | 33.47142 |
| 74.285714 | 33.5838 |
| 74.47619 | 33.69635 |
| 74.666667 | 33.80903 |
| 74.857143 | 33.9218 |
| 75.047619 | 34.03465 |
| 75.238095 | 34.14754 |
| 75.428571 | 34.26047 |
| 75.619048 | 34.37342 |
| 75.809524 | 34.48637 |
| 76 | 34.6 |
Data tables, one per series (34 points, 400 points)
| x from the cold wall (mm) | Experiment (Betts and Bokhari) |
|---|---|
| 1.7 | -0.14 |
| 2.7 | -0.172 |
| 3.7 | -0.18 |
| 4.7 | -0.179 |
| 5.7 | -0.164 |
| 6.7 | -0.15 |
| 7.7 | -0.133 |
| 8.7 | -0.122 |
| 10.7 | -0.09 |
| 12.7 | -0.067 |
| 14.7 | -0.051 |
| 16.7 | -0.036 |
| 18.7 | -0.025 |
| 23.7 | -0.006 |
| 28.7 | 0.012 |
| 33.7 | 0.02 |
| 38.7 | 0.032 |
| 43.7 | 0.04 |
| 48.7 | 0.058 |
| 53.7 | 0.067 |
| 58.7 | 0.08 |
| 60.7 | 0.088 |
| 62.7 | 0.09 |
| 64.7 | 0.096 |
| 65.7 | 0.097 |
| 66.7 | 0.101 |
| 67.7 | 0.102 |
| 68.7 | 0.103 |
| 69.7 | 0.102 |
| 70.7 | 0.096 |
| 71.7 | 0.089 |
| 72.7 | 0.085 |
| 73.7 | 0.069 |
| 74.7 | 0.052 |
| x from the cold wall (mm) | Simulation, finest grid |
|---|---|
| 0 | 0 |
| 0.19047619 | -0.017569271 |
| 0.38095238 | -0.03394377 |
| 0.57142857 | -0.0492496 |
| 0.76190476 | -0.063529751 |
| 0.95238095 | -0.076720136 |
| 1.1428571 | -0.088984316 |
| 1.3333333 | -0.10028392 |
| 1.5238095 | -0.11058993 |
| 1.7142857 | -0.12001368 |
| 1.9047619 | -0.12857141 |
| 2.0952381 | -0.13628838 |
| 2.2857143 | -0.1431993 |
| 2.4761905 | -0.14934846 |
| 2.6666667 | -0.15476664 |
| 2.8571429 | -0.15930329 |
| 3.047619 | -0.16318911 |
| 3.2380952 | -0.16649889 |
| 3.4285714 | -0.16920386 |
| 3.6190476 | -0.17113141 |
| 3.8095238 | -0.17266414 |
| 4 | -0.17363872 |
| 4.1904762 | -0.17405674 |
| 4.3809524 | -0.174243 |
| 4.5714286 | -0.17374764 |
| 4.7619048 | -0.17315722 |
| 4.952381 | -0.17204097 |
| 5.1428571 | -0.17084902 |
| 5.3333333 | -0.16925624 |
| 5.5238095 | -0.16763753 |
| 5.7142857 | -0.16569206 |
| 5.9047619 | -0.16374659 |
| 6.0952381 | -0.16159528 |
| 6.2857143 | -0.15940982 |
| 6.4761905 | -0.15714506 |
| 6.6666667 | -0.15480198 |
| 6.8571429 | -0.15245878 |
| 7.047619 | -0.14999523 |
| 7.2380952 | -0.14753169 |
| 7.4285714 | -0.14503519 |
| 7.6190476 | -0.14247535 |
| 7.8095238 | -0.13991551 |
| 8 | -0.1373327 |
| 8.1904762 | -0.13472842 |
| 8.3809524 | -0.13212414 |
| 8.5714286 | -0.12953144 |
| 8.7619048 | -0.12694965 |
| 8.952381 | -0.12436785 |
| 9.1428571 | -0.12181245 |
| 9.3333333 | -0.11931192 |
| 9.5238095 | -0.1168114 |
| 9.7142857 | -0.11431088 |
| 9.9047619 | -0.11193 |
| 10.095238 | -0.10955747 |
| 10.285714 | -0.10718495 |
| 10.47619 | -0.10486641 |
| 10.666667 | -0.10265619 |
| 10.857143 | -0.10044598 |
| 11.047619 | -0.098235761 |
| 11.238095 | -0.09611886 |
| 11.428571 | -0.094093455 |
| 11.619048 | -0.092068051 |
| 11.809524 | -0.090042646 |
| 12 | -0.08810323 |
| 12.190476 | -0.086274362 |
| 12.380952 | -0.084445495 |
| 12.571429 | -0.082616627 |
| 12.761905 | -0.080810704 |
| 12.952381 | -0.079180628 |
| 13.142857 | -0.077550553 |
| 13.333333 | -0.075920477 |
| 13.52381 | -0.074290401 |
| 13.714286 | -0.072761208 |
| 13.904762 | -0.071324143 |
| 14.095238 | -0.069887079 |
| 14.285714 | -0.068450014 |
| 14.47619 | -0.067012949 |
| 14.666667 | -0.065691995 |
| 14.857143 | -0.064435689 |
| 15.047619 | -0.063179383 |
| 15.238095 | -0.061923077 |
| 15.428571 | -0.060666771 |
| 15.619048 | -0.059485186 |
| 15.809524 | -0.058392587 |
| 16 | -0.057299989 |
| 16.190476 | -0.056207391 |
| 16.380952 | -0.055114793 |
| 16.571429 | -0.054022195 |
| 16.761905 | -0.053065367 |
| 16.952381 | -0.052116325 |
| 17.142857 | -0.051167282 |
| 17.333333 | -0.05021824 |
| 17.52381 | -0.049269197 |
| 17.714286 | -0.048331133 |
| 17.904762 | -0.047504013 |
| 18.095238 | -0.046676893 |
| 18.285714 | -0.045849772 |
| 18.47619 | -0.045022652 |
| 18.666667 | -0.044195532 |
| 18.857143 | -0.043368411 |
| 19.047619 | -0.042628235 |
| 19.238095 | -0.04190132 |
| 19.428571 | -0.041174406 |
| 19.619048 | -0.040447492 |
| 19.809524 | -0.039720578 |
| 20 | -0.038993663 |
| 20.190476 | -0.038287056 |
| 20.380952 | -0.037639584 |
| 20.571429 | -0.036992112 |
| 20.761905 | -0.03634464 |
| 20.952381 | -0.035697168 |
| 21.142857 | -0.035049696 |
| 21.333333 | -0.034402224 |
| 21.52381 | -0.033768564 |
| 21.714286 | -0.033181262 |
| 21.904762 | -0.032593959 |
| 22.095238 | -0.032006656 |
| 22.285714 | -0.031419353 |
| 22.47619 | -0.03083205 |
| 22.666667 | -0.030244747 |
| 22.857143 | -0.029657444 |
| 23.047619 | -0.029102433 |
| 23.238095 | -0.028557423 |
| 23.428571 | -0.028012413 |
| 23.619048 | -0.027467403 |
| 23.809524 | -0.026922394 |
| 24 | -0.026377384 |
| 24.190476 | -0.025832374 |
| 24.380952 | -0.025287364 |
| 24.571429 | -0.024765293 |
| 24.761905 | -0.024247921 |
| 24.952381 | -0.023730549 |
| 25.142857 | -0.023213177 |
| 25.333333 | -0.022695804 |
| 25.52381 | -0.022178432 |
| 25.714286 | -0.02166106 |
| 25.904762 | -0.021143687 |
| 26.095238 | -0.02063365 |
| 26.285714 | -0.02013463 |
| 26.47619 | -0.01963561 |
| 26.666667 | -0.01913659 |
| 26.857143 | -0.01863757 |
| 27.047619 | -0.01813855 |
| 27.238095 | -0.01763953 |
| 27.428571 | -0.01714051 |
| 27.619048 | -0.01664149 |
| 27.809524 | -0.016147966 |
| 28 | -0.015661393 |
| 28.190476 | -0.015174821 |
| 28.380952 | -0.014688249 |
| 28.571429 | -0.014201676 |
| 28.761905 | -0.013715104 |
| 28.952381 | -0.013228532 |
| 29.142857 | -0.012741959 |
| 29.333333 | -0.012255387 |
| 29.52381 | -0.011768814 |
| 29.714286 | -0.011289022 |
| 29.904762 | -0.010809801 |
| 30.095238 | -0.01033058 |
| 30.285714 | -0.009851359 |
| 30.47619 | -0.0093721378 |
| 30.666667 | -0.0088929166 |
| 30.857143 | -0.0084136955 |
| 31.047619 | -0.0079344743 |
| 31.238095 | -0.0074552532 |
| 31.428571 | -0.006976032 |
| 31.619048 | -0.0065047586 |
| 31.809524 | -0.0060353843 |
| 32 | -0.0055660101 |
| 32.190476 | -0.0050966358 |
| 32.380952 | -0.0046272615 |
| 32.571429 | -0.0041578872 |
| 32.761905 | -0.0036885129 |
| 32.952381 | -0.0032191387 |
| 33.142857 | -0.0027497644 |
| 33.333333 | -0.0022803901 |
| 33.52381 | -0.0018108642 |
| 33.714286 | -0.0013388983 |
| 33.904762 | -0.00086693251 |
| 34.095238 | -0.00039496668 |
| 34.285714 | 0.000076999138 |
| 34.47619 | 0.00054896496 |
| 34.666667 | 0.0010209308 |
| 34.857143 | 0.0014928966 |
| 35.047619 | 0.0019648624 |
| 35.238095 | 0.0024368283 |
| 35.428571 | 0.0029087941 |
| 35.619048 | 0.0033807599 |
| 35.809524 | 0.0038564283 |
| 36 | 0.0043342078 |
| 36.190476 | 0.0048119873 |
| 36.380952 | 0.0052897668 |
| 36.571429 | 0.0057675463 |
| 36.761905 | 0.0062453258 |
| 36.952381 | 0.0067231053 |
| 37.142857 | 0.0072008848 |
| 37.333333 | 0.0076786643 |
| 37.52381 | 0.0081564438 |
| 37.714286 | 0.0086342233 |
| 37.904762 | 0.0091120028 |
| 38.095238 | 0.0095944756 |
| 38.285714 | 0.010081642 |
| 38.47619 | 0.010568808 |
| 38.666667 | 0.011055974 |
| 38.857143 | 0.01154314 |
| 39.047619 | 0.012030306 |
| 39.238095 | 0.012517472 |
| 39.428571 | 0.013004638 |
| 39.619048 | 0.013491804 |
| 39.809524 | 0.01397897 |
| 40 | 0.014466136 |
| 40.190476 | 0.014953302 |
| 40.380952 | 0.015447604 |
| 40.571429 | 0.01595442 |
| 40.761905 | 0.016461236 |
| 40.952381 | 0.016968053 |
| 41.142857 | 0.017474869 |
| 41.333333 | 0.017981685 |
| 41.52381 | 0.018488501 |
| 41.714286 | 0.018995318 |
| 41.904762 | 0.019502134 |
| 42.095238 | 0.02000895 |
| 42.285714 | 0.020515767 |
| 42.47619 | 0.021022583 |
| 42.666667 | 0.021542481 |
| 42.857143 | 0.022063193 |
| 43.047619 | 0.022583905 |
| 43.238095 | 0.023104616 |
| 43.428571 | 0.023625328 |
| 43.619048 | 0.02414604 |
| 43.809524 | 0.024666752 |
| 44 | 0.025187463 |
| 44.190476 | 0.025708175 |
| 44.380952 | 0.026228887 |
| 44.571429 | 0.026752468 |
| 44.761905 | 0.027288055 |
| 44.952381 | 0.027823642 |
| 45.142857 | 0.02835923 |
| 45.333333 | 0.028894817 |
| 45.52381 | 0.029430404 |
| 45.714286 | 0.029965992 |
| 45.904762 | 0.030501579 |
| 46.095238 | 0.031037166 |
| 46.285714 | 0.031572753 |
| 46.47619 | 0.032109546 |
| 46.666667 | 0.032660658 |
| 46.857143 | 0.033211769 |
| 47.047619 | 0.03376288 |
| 47.238095 | 0.034313992 |
| 47.428571 | 0.034865103 |
| 47.619048 | 0.035416214 |
| 47.809524 | 0.035967326 |
| 48 | 0.036518437 |
| 48.190476 | 0.037069548 |
| 48.380952 | 0.037629667 |
| 48.571429 | 0.038196906 |
| 48.761905 | 0.038764145 |
| 48.952381 | 0.039331384 |
| 49.142857 | 0.039898623 |
| 49.333333 | 0.040465863 |
| 49.52381 | 0.041033102 |
| 49.714286 | 0.041600341 |
| 49.904762 | 0.04216758 |
| 50.095238 | 0.042744846 |
| 50.285714 | 0.043328789 |
| 50.47619 | 0.043912731 |
| 50.666667 | 0.044496673 |
| 50.857143 | 0.045080616 |
| 51.047619 | 0.045664558 |
| 51.238095 | 0.046248501 |
| 51.428571 | 0.046832443 |
| 51.619048 | 0.047419307 |
| 51.809524 | 0.048020434 |
| 52 | 0.048621561 |
| 52.190476 | 0.049222688 |
| 52.380952 | 0.049823815 |
| 52.571429 | 0.050424942 |
| 52.761905 | 0.051026069 |
| 52.952381 | 0.051627195 |
| 53.142857 | 0.052232484 |
| 53.333333 | 0.052851212 |
| 53.52381 | 0.053469941 |
| 53.714286 | 0.054088669 |
| 53.904762 | 0.054707397 |
| 54.095238 | 0.055326125 |
| 54.285714 | 0.055944853 |
| 54.47619 | 0.056563581 |
| 54.666667 | 0.057196153 |
| 54.857143 | 0.05783285 |
| 55.047619 | 0.058469547 |
| 55.238095 | 0.059106245 |
| 55.428571 | 0.059742942 |
| 55.619048 | 0.060379639 |
| 55.809524 | 0.061016336 |
| 56 | 0.061666648 |
| 56.190476 | 0.062321634 |
| 56.380952 | 0.06297662 |
| 56.571429 | 0.063631606 |
| 56.761905 | 0.064286593 |
| 56.952381 | 0.064941579 |
| 57.142857 | 0.06559902 |
| 57.333333 | 0.066272553 |
| 57.52381 | 0.066946087 |
| 57.714286 | 0.067619621 |
| 57.904762 | 0.068293154 |
| 58.095238 | 0.068966688 |
| 58.285714 | 0.069640222 |
| 58.47619 | 0.070330786 |
| 58.666667 | 0.071023035 |
| 58.857143 | 0.071715284 |
| 59.047619 | 0.072407533 |
| 59.238095 | 0.073099782 |
| 59.428571 | 0.073793048 |
| 59.619048 | 0.07450404 |
| 59.809524 | 0.075215032 |
| 60 | 0.075926024 |
| 60.190476 | 0.076637016 |
| 60.380952 | 0.077348008 |
| 60.571429 | 0.078069084 |
| 60.761905 | 0.078798627 |
| 60.952381 | 0.079528171 |
| 61.142857 | 0.080257714 |
| 61.333333 | 0.080987257 |
| 61.52381 | 0.081723244 |
| 61.714286 | 0.082470805 |
| 61.904762 | 0.083218366 |
| 62.095238 | 0.083965927 |
| 62.285714 | 0.084713488 |
| 62.47619 | 0.085469144 |
| 62.666667 | 0.086233663 |
| 62.857143 | 0.086998182 |
| 63.047619 | 0.087762701 |
| 63.238095 | 0.088527221 |
| 63.428571 | 0.089305093 |
| 63.619048 | 0.090084707 |
| 63.809524 | 0.090864321 |
| 64 | 0.091643935 |
| 64.190476 | 0.092430306 |
| 64.380952 | 0.093221933 |
| 64.571429 | 0.094013559 |
| 64.761905 | 0.094805186 |
| 64.952381 | 0.095600326 |
| 65.142857 | 0.09639905 |
| 65.333333 | 0.097197774 |
| 65.52381 | 0.097996498 |
| 65.714286 | 0.098794867 |
| 65.904762 | 0.099593057 |
| 66.095238 | 0.10039125 |
| 66.285714 | 0.10118865 |
| 66.47619 | 0.10197473 |
| 66.666667 | 0.10276081 |
| 66.857143 | 0.10354689 |
| 67.047619 | 0.10431324 |
| 67.238095 | 0.10507009 |
| 67.428571 | 0.10582695 |
| 67.619048 | 0.10655774 |
| 67.809524 | 0.10726088 |
| 68 | 0.10796402 |
| 68.190476 | 0.10862504 |
| 68.380952 | 0.10924097 |
| 68.571429 | 0.10985691 |
| 68.761905 | 0.11038711 |
| 68.952381 | 0.11087272 |
| 69.142857 | 0.11135832 |
| 69.333333 | 0.11166169 |
| 69.52381 | 0.11196489 |
| 69.714286 | 0.11215029 |
| 69.904762 | 0.11221645 |
| 70.095238 | 0.11224141 |
| 70.285714 | 0.11201806 |
| 70.47619 | 0.1117947 |
| 70.666667 | 0.11126043 |
| 70.857143 | 0.11070147 |
| 71.047619 | 0.10983232 |
| 71.238095 | 0.1089046 |
| 71.428571 | 0.10763509 |
| 71.619048 | 0.10630571 |
| 71.809524 | 0.10459134 |
| 72 | 0.10276006 |
| 72.190476 | 0.10064803 |
| 72.380952 | 0.098278108 |
| 72.571429 | 0.095728873 |
| 72.761905 | 0.092843344 |
| 72.952381 | 0.089709652 |
| 73.142857 | 0.086344354 |
| 73.333333 | 0.082723393 |
| 73.52381 | 0.078767471 |
| 73.714286 | 0.074541568 |
| 73.904762 | 0.070039445 |
| 74.095238 | 0.065250197 |
| 74.285714 | 0.060166396 |
| 74.47619 | 0.054783685 |
| 74.666667 | 0.049100412 |
| 74.857143 | 0.043082785 |
| 75.047619 | 0.036743992 |
| 75.238095 | 0.030099449 |
| 75.428571 | 0.023097851 |
| 75.619048 | 0.015762465 |
| 75.809524 | 0.008081032 |
| 76 | 9.037032e-15 |
| Quantity | Experiment | Simulation, finest grid | Signed difference |
|---|---|---|---|
| Mean Nusselt number | 5.85 | 4.658 | −20.4 % |
| Peak upward velocity at y/H 0.5 | 0.140 m/s | 0.1664 m/s | +19 % |
| Mean temperature, RMS difference across the cavity, 9 heights | – | – | 0.41–1.45 K |
| Temperature normal to floor / roof at x 38.1 mm, RMS difference | – | – | 0.31 K / 0.85 K |
Refining the grid moves Nu towards the experiment, but by very little. The least-squares extrapolation is 4.678, still −20 % from 5.85, so the difference is not a grid effect.
The temperature in the core of the cavity agrees to about 0.5 K; across the whole width the RMS difference is 0.41–1.45 K over the nine heights (0.32 K at y/H 0.10 if the four suspect points are left out). The velocity peaks are too high: at mid-height the upward peak is 0.1664 m/s against 0.140 m/s.
The measured temperature gradients next to the side walls are steeper than mine at every height, by 15–55 % (my 3-point fits to the measured points at x = 0.33–0.84 mm). That is consistent with the heat-transfer deficit sitting in the wall layers, but it is my inference from three points per wall, not a measurement of the cause.
8Numerical accuracy
Method: the Eça and Hoekstra least-squares procedure on all four grids, run with the project's one shared implementation (gci.py). It finds an observed order of 1.344 (formal order 2), monotone convergence, an extrapolated value of 4.678 and an uncertainty of 0.0254 on the finest-grid Nu (0.545 %, safety factor 1.25). The case write-up rounds these to order 1.34 and ±0.025 (0.55 %).
The observed order is well below 2, so the grids are not in the textbook asymptotic range; four grids are what make that visible. The least-squares code has unit tests but no regression against a published numerical example yet.
The peak velocity has no asymptotic order: its uncertainty is only bounded, ≤ 0.0019 m/s. The temperature profiles change by at most 0.02 K across the ladder.
Output of the shared GCI tool, unedited
Mean Nu, four grids, least squares
LSR      Eca & Hoekstra 2014 least-squares, ng=4  (h sorted finest->coarsest: 1.0000, 1.4187, 2.0160, 2.8375)
         f: 4.657889, 4.645900, 4.626232, 4.596175
         delta_RE unweighted p =   1.3392   sigma = 0.0001339
         delta_RE eq16       p =   1.3440   sigma = 0.0001332
         observed order p = 1.344   (formal 2.0)   verdict: apparently monotonic
         chosen fit: p-free (eq16)   phi0 = 4.678092   alpha = -0.0201744
         sigma = 0.0001332   Delta_phi = 0.02057   F_sigma = 0.006  (want < 1)
         U_phi(finest) = 0.0253794  (0.545 % of f_fine; eq (20); Fs=1.25; eps=0.02017, sigma=0.0001332, |f-fit|=2.824e-05)
From data/betts-bokhari-cavity/gci.json (lsr_4grid), written by pipeline/build_assets.py.
9Why they differ, and what I distrust
Limits, as recorded in the ledger. A comparison, not an ASME V&V 20 validation: the experimental mean Nu 5.85 is quoted second-hand from the ERCOFTAC KBwiki UFR 4-10 page, with its definition and uncertainty unknown. 2-D slice of a 3-D rig; top and bottom wall temperatures are imposed from the experiment. The 20 % deficit appears in the wall layers (experimental gradient about 40 % steeper at mid-height, a 3-point inference); the 'too laminar' hypothesis is untested. Order 1.34 on 4 grids, LSR band 0.5 %. Data CC BY-NC-SA 4.0.
- The experimental 5.85 is quoted second-hand from the KBwiki page. Its definition (which walls, which reference temperature difference, whether losses are corrected) and its uncertainty are unknown, so part of the gap may be definitional. Until I read the Betts and Bokhari paper this is a comparison, not an ASME V&V 20 validation.
- The rig is 3-D and I solve a 2-D slice of its mid-plane.
- The top and bottom wall temperatures are imposed from the same experiment's measurements, not predicted.
- The wall-layer location of the deficit rests on 3-point gradient fits to thermocouple readings less than a millimetre from the wall, whose position uncertainty I do not know.
- My hypothesis that the RANS model keeps the wall layers too laminar, which would also explain the over-predicted velocity peaks, is untested: a second turbulence model on the finest grid is owed.
- The solver treats air as a constant-property perfect gas; the source places the flow in the Boussinesq regime (temperature ratio 0.033), so this should matter little, but I have not checked it.
- The peak velocity is read from the sampled points, so its value snaps between sample positions.
10References
- Betts, P.L., Bokhari, I.H. (2000). Experiments on turbulent natural convection in an enclosed tall cavity. Int. J. Heat and Fluid Flow, Vol. 21, pp. 675-683. (Cited from the ERCOFTAC page; closed access, not read.)
- ERCOFTAC Classic Collection, case 079: turbulent natural convection in an enclosed tall cavity (University of Manchester). Data CC BY-NC-SA 4.0. http://cfd.mace.manchester.ac.uk/ercoftac/doku.php?id=cases:case079
- ERCOFTAC KBwiki, UFR 4-10: natural convection in simple closed cavity, N. Waterson (Mott MacDonald Ltd), ERCOFTAC 2004. Source of the quoted mean Nusselt number. https://www.kbwiki.ercoftac.org/w/index.php?title=UFR_4-10_Test_Case
- Eça and Hoekstra (2014): the least-squares numerical-uncertainty procedure, as implemented in the project's gci.py.
Source files
D:/CFD/heat-transfer/betts-bokhari-cavity/CASE-STUDY.mdD:/CFD/heat-transfer/betts-bokhari-cavity/ladder.txtD:/CFD/heat-transfer/betts-bokhari-cavity/compare.pyD:/CFD/heat-transfer/betts-bokhari-cavity/g0.5/, g0.7071/, g1.0/, g1.4142/ (RESULT.txt, log.checkMesh)D:/CFD/heat-transfer/betts-bokhari-cavity/g1.4142/0/, constant/, system/D:/CFD/heat-transfer/betts-bokhari-cavity/g1.4142/postProcessing/profiles/35000/D:/CFD/data/heat-transfer/betts-bokhari-cavity-case079/Low-Ra/ and SOURCE.mdsite/public/data/betts-bokhari-cavity/ (CSV copies, README.txt, chart JSON and gci.json from pipeline/case_data/betts-bokhari-cavity.py)
Last updated 2026-11-14. One-page summary (prints to one A4 page), also as a PDF. Every number on this page is checked against its source file by pipeline/check_numbers.py.