Laminar cylinder wake at Re 150: the Strouhal number is within 0.84 % of a published simulation on all four grids
Only the shedding frequency holds up. On the finest grid St is 0.1839 against 0.1841 (−0.13 %), but the three finest grids do not converge monotonically, so the shared GCI tool refuses a three-grid band. Mean drag and the lift fluctuation are +1.35 % and +5.5 % off and have no defensible band at all.
- Strouhal number, simulation
- 0.1839
- finest of four grids
- Strouhal number, reference
- 0.1841
- Qu et al. 2013, a 2-D simulation
- Signed difference
- −0.13 %
- simulation minus reference
- Numerical uncertainty
- GCI refused
- three finest grids; least squares on four: 0.1828 ± 0.97 %
2Geometry, mesh, results
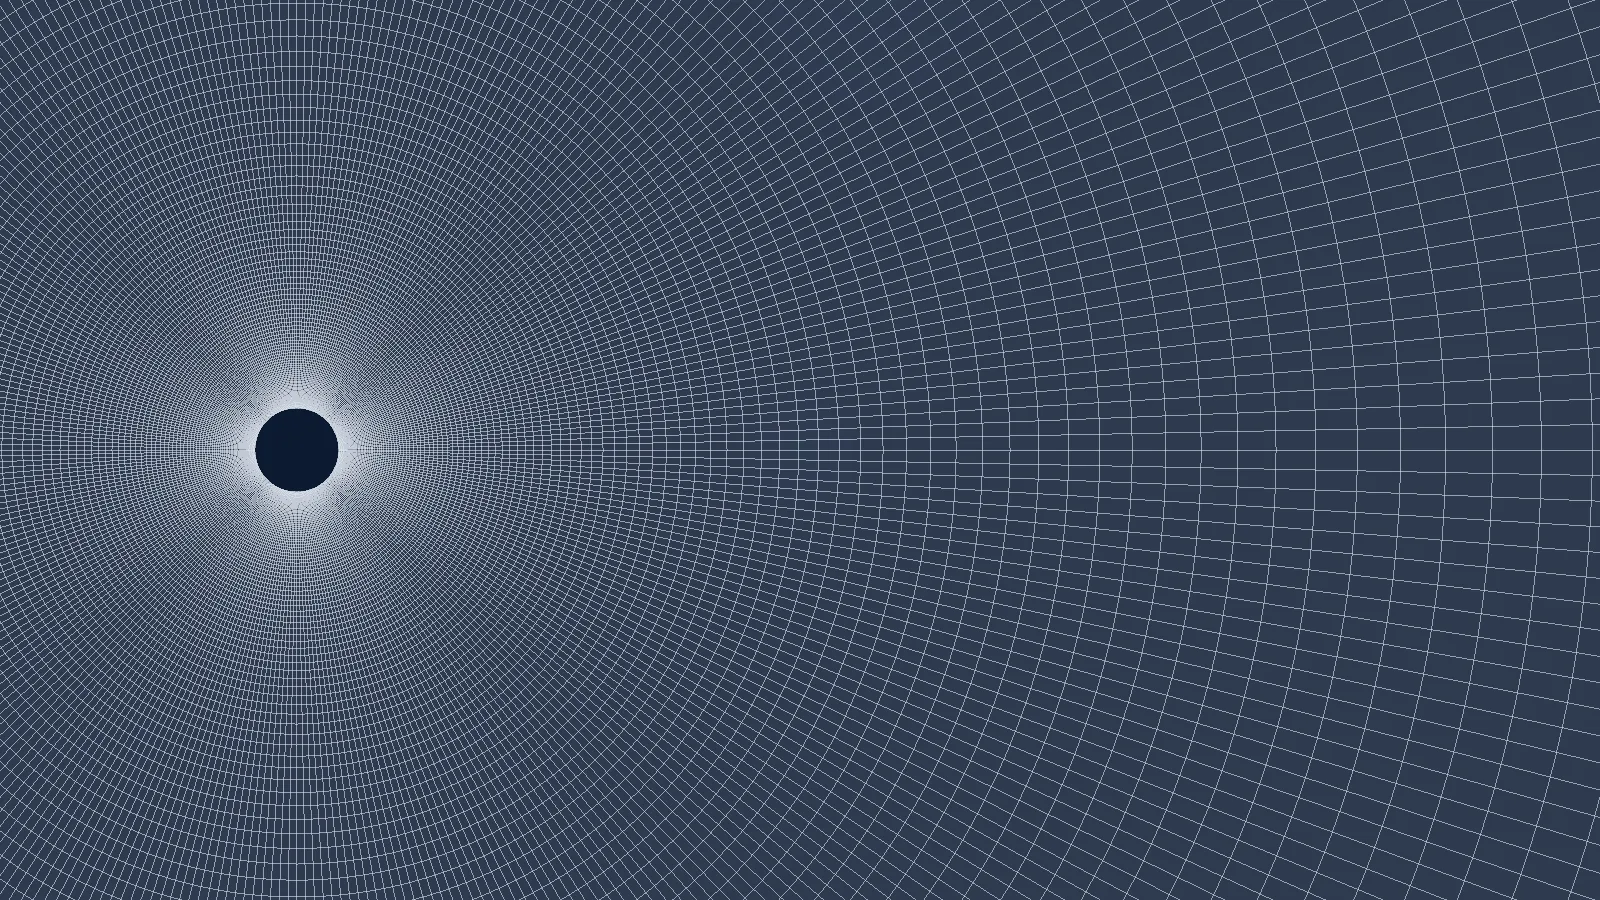
Circular cylinder in an O-shaped domain reaching 50 diameters; the cylinder wall and the far-field boundary drawn as lines.

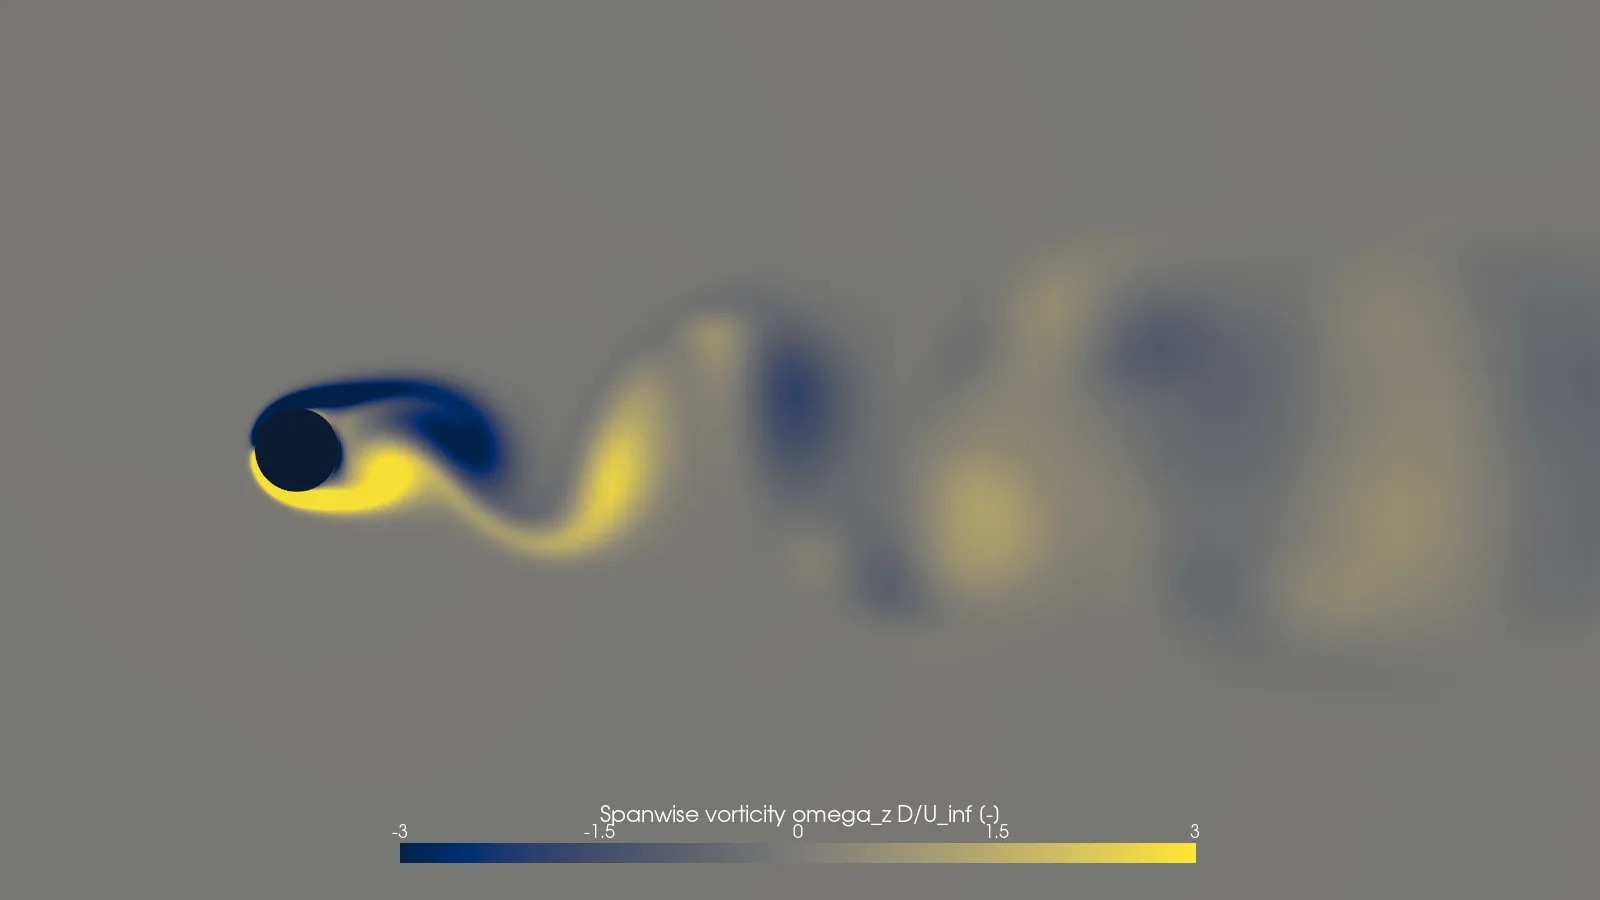
No poster exported for this step.
Drag to pan, wheel or pinch to zoom, click to read a value. Keys: arrows pan, + and − zoom, Enter reads the value at the centre.
3Case parameters
| Reynolds number (free-stream speed, diameter) | 150 |
|---|---|
| Scales | Non-dimensional: D = 1, U = 1, kinematic viscosity 0.006666666667 (1/Re) |
| Domain | O-grid to a radius of 50 D |
| Solver | OpenFOAM v2412, pimpleFoam (transient, incompressible) |
| Turbulence model | None: laminar |
| Wall treatment | Resolved: first radial cell 0.0067 D on the finest grid |
| Time step, finest grid | 0.005 |
| Cells | 5,600, 11,200, 22,572, 44,800 |
| Run cost | Not recorded |
4Experiment
There is no experiment on this page. The reference is a published set of 2-D simulations: Qu, Norberg and Davidson (2013), Table 3, the Re 150 row with a domain of H = 100 diameters, computed on 386 × 322 cells, time step 0.01. I read the table from the paper myself (the values are transcribed in the case's SPEC.md).
The reference gives mean drag 1.305, rms lift 0.3546 and Strouhal number 0.1841. The rms drag 0.0173 is not a printed column: it follows from the paper's lift-to-drag fluctuation ratio, as the SPEC records.
A direct numerical simulation value of St 0.183 (Inoue and Hatakeyama 2002) is quoted by two later papers; I could not obtain the original, so I do not compare against it.
| Stated uncertainty | No uncertainty is stated for the reference values. The authors report sensitivities: at Re 100, changing the domain size moved the forces by about 1.2 % in CD and 1.9 % in CL'; a coarser time step cut the fluctuations by 9.8 % in CL' and about 16 % in CD'. |
|---|---|
| Blockage and corrections | Not applicable: a simulation reference, no tunnel. |
| Licence | Values quoted from Qu, Norberg and Davidson (2013), Table 3 (author's version, Chalmers Publication Library). The paper is cited, not redistributed. |
Reference values, Qu et al. 2013 Table 3, Re 150: mean drag 1.305, rms lift 0.3546, Strouhal number 0.1841
5Set-up
A cylinder of unit diameter in a circular domain of radius 50 D, one cell thick in the span. Four geometrically similar O-grids, each refined by about 1.41 in both directions at a constant wall-normal expansion ratio (300 from first to last radial cell). The time step scales with the cell size, so the Courant number stays the same on every grid.
The initial velocity carries a small cross-flow component, (1 0.02 0), to start the shedding sooner. Shedding saturates from about t about 87; the statistics use the last 10 lift cycles, t = 141.674 to 196.064 on the finest grid, of a run to t = 200.
| Boundary | Type | Value |
|---|---|---|
| Cylinder wall | no-slip (noSlip); pressure zeroGradient | |
| Far field (circle at 50 D) | freestreamVelocity; freestreamPressure | U (1 0 0); p 0 |
| Front and back | empty (2-D) |
Numerics and convergence
pimpleFoam in PISO mode (1 outer corrector, 2 pressure correctors), backward time stepping, Gauss linear convection. Maximum Courant number over the run 0.877 on the finest grid.
Force coefficients use a reference area of 0.1 (the one-cell span times the diameter), free-stream speed 1 and length 1.
6Mesh
| Cells, finest grid | 44,800 |
|---|---|
| Structure | O-grid, four blocks of 80 × 140 cells (around, radial) |
| First radial cell, finest grid | 0.0067 D |
| Max non-orthogonality | 1.7e-06 degrees |
| Max skewness | 0.012 |
| Max aspect ratio | 2.04 |
| checkMesh verdict, finest grid | “Mesh OK.” |
| Grid | Cells | Time step | St | Mean Cd | rms Cl | Max skewness | checkMesh |
|---|---|---|---|---|---|---|---|
| g0.3536 (coarsest) | 5,600 | 0.0141403 | 0.185641 | 1.3239 | 0.363521 | 0.038 | “Mesh OK.” |
| g0.5 | 11,200 | 0.01 | 0.184592 | 1.33463 | 0.384773 | 0.025 | “Mesh OK.” |
| g0.7071 | 22,572 | 0.00707114 | 0.184513 | 1.32997 | 0.378915 | 0.017 | “Mesh OK.” |
| g1 (finest) | 44,800 | 0.005 | 0.183855 | 1.32266 | 0.374123 | 0.012 | “Mesh OK.” |
Every grid passed checkMesh. Mean drag and rms lift go up then down with refinement; the coarsest grid is the outlier.
7Results
On the finest grid the Strouhal number is 0.183855, against 0.1841 from Qu et al. (−0.13 %). Every grid is within 0.84 %.
Data table (4 rows)
| Cells | Simulation, pimpleFoam laminar | Reference, Qu et al. 2013 (simulation) |
|---|---|---|
| 5600 | 0.185641 | 0.1841 |
| 11200 | 0.184592 | 0.1841 |
| 22572 | 0.184513 | 0.1841 |
| 44800 | 0.183855 | 0.1841 |
Data tables, one per series (908 points)
| Time (D / U) | Lift coefficient, finest grid |
|---|---|
| 145.61 | -0.52418902464 |
| 145.67 | -0.52807397323 |
| 145.73 | -0.52947177219 |
| 145.79 | -0.52823034466 |
| 145.85 | -0.52447307237 |
| 145.91 | -0.51827090445 |
| 145.97 | -0.50946143409 |
| 146.03 | -0.49851822115 |
| 146.09 | -0.48493841986 |
| 146.15 | -0.46941614026 |
| 146.21 | -0.45138678566 |
| 146.27 | -0.4315563131 |
| 146.33 | -0.40982495403 |
| 146.39 | -0.38622201178 |
| 146.45 | -0.36058958833 |
| 146.51 | -0.33331676774 |
| 146.57 | -0.30471967915 |
| 146.63 | -0.27463541788 |
| 146.69 | -0.2431504446 |
| 146.75 | -0.21045206723 |
| 146.81 | -0.17672701529 |
| 146.87 | -0.142208 |
| 146.93 | -0.10699181412 |
| 146.99 | -0.071202658386 |
| 147.05 | -0.034855662249 |
| 147.11 | 0.001608413571 |
| 147.17 | 0.038445821054 |
| 147.23 | 0.074925658459 |
| 147.29 | 0.11125645397 |
| 147.35 | 0.14688313421 |
| 147.41 | 0.18222266432 |
| 147.47 | 0.21669649131 |
| 147.53 | 0.25001267036 |
| 147.59 | 0.28210618508 |
| 147.65 | 0.31307092859 |
| 147.71 | 0.34238708455 |
| 147.77 | 0.3700966282 |
| 147.83 | 0.39578514397 |
| 147.89 | 0.41961644052 |
| 147.95 | 0.4413900361 |
| 148.01 | 0.46086696536 |
| 148.07 | 0.4781717492 |
| 148.13 | 0.49287733255 |
| 148.19 | 0.5052615937 |
| 148.25 | 0.5151255878 |
| 148.31 | 0.52239879311 |
| 148.37 | 0.52709934039 |
| 148.43 | 0.52933305684 |
| 148.49 | 0.52880204584 |
| 148.55 | 0.5259361912 |
| 148.61 | 0.52048577271 |
| 148.67 | 0.51261597922 |
| 148.73 | 0.50240019205 |
| 148.79 | 0.48965121247 |
| 148.85 | 0.47472681148 |
| 148.91 | 0.45740757657 |
| 148.97 | 0.43827423843 |
| 149.03 | 0.41711531026 |
| 149.09 | 0.39402708243 |
| 149.15 | 0.36896434714 |
| 149.21 | 0.34236606735 |
| 149.27 | 0.31405186112 |
| 149.33 | 0.28438257842 |
| 149.39 | 0.2534640202 |
| 149.45 | 0.22119027494 |
| 149.51 | 0.1876871097 |
| 149.57 | 0.15357765928 |
| 149.63 | 0.11822456287 |
| 149.69 | 0.082784744922 |
| 149.75 | 0.046687797694 |
| 149.81 | 0.010131213359 |
| 149.87 | -0.026438489053 |
| 149.93 | -0.063051502264 |
| 149.99 | -0.099534397834 |
| 150.05 | -0.13537197155 |
| 150.11 | -0.17086098104 |
| 150.17 | -0.20568876491 |
| 150.23 | -0.23924736608 |
| 150.29 | -0.27209081935 |
| 150.35 | -0.30311201026 |
| 150.41 | -0.33298909129 |
| 150.47 | -0.36114098358 |
| 150.53 | -0.38762461901 |
| 150.59 | -0.41213662538 |
| 150.65 | -0.43456547275 |
| 150.71 | -0.45477987839 |
| 150.77 | -0.47278388676 |
| 150.83 | -0.48834247587 |
| 150.89 | -0.50154635389 |
| 150.95 | -0.51230951716 |
| 151.01 | -0.52046055681 |
| 151.07 | -0.52576494964 |
| 151.13 | -0.52883994735 |
| 151.19 | -0.52928426155 |
| 151.25 | -0.52718142001 |
| 151.31 | -0.52253935441 |
| 151.37 | -0.51542286868 |
| 151.43 | -0.50581780059 |
| 151.49 | -0.49400052303 |
| 151.55 | -0.47969484401 |
| 151.61 | -0.4632578502 |
| 151.67 | -0.44478860705 |
| 151.73 | -0.42417306805 |
| 151.79 | -0.40173053032 |
| 151.85 | -0.3772513217 |
| 151.91 | -0.3512854849 |
| 151.97 | -0.32346100925 |
| 152.03 | -0.29417352426 |
| 152.09 | -0.26368045624 |
| 152.15 | -0.23176454757 |
| 152.21 | -0.19877236659 |
| 152.27 | -0.16477592917 |
| 152.33 | -0.12993037122 |
| 152.39 | -0.094409645267 |
| 152.45 | -0.058352169512 |
| 152.51 | -0.021914873596 |
| 152.57 | 0.014746954354 |
| 152.63 | 0.051279564471 |
| 152.69 | 0.087645805863 |
| 152.75 | 0.12380127912 |
| 152.81 | 0.15951222583 |
| 152.87 | 0.19457512422 |
| 152.93 | 0.22845340922 |
| 152.99 | 0.26162741411 |
| 153.05 | 0.29315951286 |
| 153.11 | 0.32359741768 |
| 153.17 | 0.3522884549 |
| 153.23 | 0.37935544028 |
| 153.29 | 0.40434236818 |
| 153.35 | 0.4275317812 |
| 153.41 | 0.44850741586 |
| 153.47 | 0.46705830634 |
| 153.53 | 0.48348260845 |
| 153.59 | 0.49756823888 |
| 153.65 | 0.50901037383 |
| 153.71 | 0.51800469194 |
| 153.77 | 0.52429067347 |
| 153.83 | 0.52813016088 |
| 153.89 | 0.52935402458 |
| 153.95 | 0.5281026136 |
| 154.01 | 0.52432301245 |
| 154.07 | 0.51803371144 |
| 154.13 | 0.50918681941 |
| 154.19 | 0.49818976108 |
| 154.25 | 0.48454126572 |
| 154.31 | 0.46888470571 |
| 154.37 | 0.45095701318 |
| 154.43 | 0.43108088664 |
| 154.49 | 0.40927133265 |
| 154.55 | 0.38547639357 |
| 154.61 | 0.3598574699 |
| 154.67 | 0.33260218183 |
| 154.73 | 0.30383816935 |
| 154.79 | 0.27382766712 |
| 154.85 | 0.24215083292 |
| 154.91 | 0.20952112183 |
| 154.97 | 0.17590917598 |
| 155.03 | 0.14117924414 |
| 155.09 | 0.10603415188 |
| 155.15 | 0.070028335387 |
| 155.21 | 0.033854102488 |
| 155.27 | -0.0027322269621 |
| 155.33 | -0.039486421212 |
| 155.39 | -0.076032049215 |
| 155.45 | -0.11231201346 |
| 155.51 | -0.14802236007 |
| 155.57 | -0.18331329304 |
| 155.63 | -0.21757197511 |
| 155.69 | -0.25095890726 |
| 155.75 | -0.28298060882 |
| 155.81 | -0.31384153575 |
| 155.87 | -0.3431223255 |
| 155.93 | -0.37080478368 |
| 155.99 | -0.39639727984 |
| 156.05 | -0.42024291303 |
| 156.11 | -0.44206383363 |
| 156.17 | -0.46133682058 |
| 156.23 | -0.47855102561 |
| 156.29 | -0.49321036485 |
| 156.35 | -0.50551610383 |
| 156.41 | -0.51528878191 |
| 156.47 | -0.52251374769 |
| 156.53 | -0.52709657211 |
| 156.59 | -0.5293594667 |
| 156.65 | -0.52875687389 |
| 156.71 | -0.52587522145 |
| 156.77 | -0.52031538802 |
| 156.83 | -0.51231825868 |
| 156.89 | -0.50206158409 |
| 156.95 | -0.4893565941 |
| 157.01 | -0.47429203793 |
| 157.07 | -0.4569070572 |
| 157.13 | -0.43771748538 |
| 157.19 | -0.41650122283 |
| 157.25 | -0.3933599106 |
| 157.31 | -0.36834373377 |
| 157.37 | -0.34170431313 |
| 157.43 | -0.31335224774 |
| 157.49 | -0.28357732371 |
| 157.55 | -0.25261287408 |
| 157.61 | -0.22026090581 |
| 157.67 | -0.18688916586 |
| 157.73 | -0.15270069542 |
| 157.79 | -0.11748049925 |
| 157.85 | -0.08187461054 |
| 157.91 | -0.045596223396 |
| 157.97 | -0.0092023243412 |
| 158.03 | 0.027493963409 |
| 158.09 | 0.063980037478 |
| 158.15 | 0.10033410044 |
| 158.21 | 0.13650944869 |
| 158.27 | 0.17174273502 |
| 158.33 | 0.20664189158 |
| 158.39 | 0.24010895419 |
| 158.45 | 0.27279229508 |
| 158.51 | 0.30393412584 |
| 158.57 | 0.33367305986 |
| 158.63 | 0.36196836441 |
| 158.69 | 0.38838142827 |
| 158.75 | 0.412748954 |
| 158.81 | 0.43508044573 |
| 158.87 | 0.45538608262 |
| 158.93 | 0.47322976437 |
| 158.99 | 0.48861442175 |
| 159.05 | 0.50185488567 |
| 159.11 | 0.51247344899 |
| 159.17 | 0.52055694439 |
| 159.23 | 0.52585235312 |
| 159.29 | 0.5289192414 |
| 159.35 | 0.52929198638 |
| 159.41 | 0.52716624876 |
| 159.47 | 0.52238074136 |
| 159.53 | 0.51515119896 |
| 159.59 | 0.50554316684 |
| 159.65 | 0.49354660535 |
| 159.71 | 0.47934796106 |
| 159.77 | 0.46277688325 |
| 159.83 | 0.44425889185 |
| 159.89 | 0.42359825767 |
| 159.95 | 0.40107795065 |
| 160.01 | 0.37671837886 |
| 160.07 | 0.35054777079 |
| 160.13 | 0.32272225238 |
| 160.19 | 0.29348417809 |
| 160.25 | 0.26270311615 |
| 160.31 | 0.23098424156 |
| 160.37 | 0.19793997344 |
| 160.43 | 0.16396450478 |
| 160.49 | 0.12902200305 |
| 160.55 | 0.093563366517 |
| 160.61 | 0.057435836503 |
| 160.67 | 0.021007033845 |
| 160.73 | -0.015665208871 |
| 160.79 | -0.052194734493 |
| 160.85 | -0.088549001688 |
| 160.91 | -0.12469182769 |
| 160.97 | -0.16048253098 |
| 161.03 | -0.1954134974 |
| 161.09 | -0.2293081937 |
| 161.15 | -0.26229580324 |
| 161.21 | -0.29388999687 |
| 161.27 | -0.32426676828 |
| 161.33 | -0.35287729195 |
| 161.39 | -0.37991856136 |
| 161.45 | -0.40492983662 |
| 161.51 | -0.42805832204 |
| 161.57 | -0.44898657653 |
| 161.63 | -0.46752762139 |
| 161.69 | -0.48382919116 |
| 161.75 | -0.49781321802 |
| 161.81 | -0.50917404058 |
| 161.87 | -0.51814796184 |
| 161.93 | -0.52441428434 |
| 161.99 | -0.52819439671 |
| 162.05 | -0.52934262476 |
| 162.11 | -0.52807551159 |
| 162.17 | -0.52418261338 |
| 162.23 | -0.51790920123 |
| 162.29 | -0.50887416778 |
| 162.35 | -0.49781298007 |
| 162.41 | -0.48412315004 |
| 162.47 | -0.46837803509 |
| 162.53 | -0.45048986049 |
| 162.59 | -0.4305156579 |
| 162.65 | -0.40867807238 |
| 162.71 | -0.38485437273 |
| 162.77 | -0.3591578027 |
| 162.83 | -0.33184922191 |
| 162.89 | -0.30311461665 |
| 162.95 | -0.27309290115 |
| 163.01 | -0.24133467796 |
| 163.07 | -0.20870903191 |
| 163.13 | -0.17498559574 |
| 163.19 | -0.14036958514 |
| 163.25 | -0.10516632272 |
| 163.31 | -0.069348439671 |
| 163.37 | -0.032925430222 |
| 163.43 | 0.0035264826284 |
| 163.49 | 0.040416354205 |
| 163.55 | 0.076690654981 |
| 163.61 | 0.11318425622 |
| 163.67 | 0.14886380457 |
| 163.73 | 0.18411794702 |
| 163.79 | 0.21853813219 |
| 163.85 | 0.25160363836 |
| 163.91 | 0.28373079214 |
| 163.97 | 0.31458165817 |
| 164.03 | 0.34375354232 |
| 164.09 | 0.37140637343 |
| 164.15 | 0.39698312151 |
| 164.21 | 0.42077785261 |
| 164.27 | 0.44256866523 |
| 164.33 | 0.46178550089 |
| 164.39 | 0.47879481322 |
| 164.45 | 0.49353370663 |
| 164.51 | 0.50572115276 |
| 164.57 | 0.51555065711 |
| 164.63 | 0.52259418336 |
| 164.69 | 0.52722142426 |
| 164.75 | 0.52923118503 |
| 164.81 | 0.52873509951 |
| 164.87 | 0.52567971393 |
| 164.93 | 0.5201464996 |
| 164.99 | 0.51201412867 |
| 165.05 | 0.50174194881 |
| 165.11 | 0.48897081616 |
| 165.17 | 0.47380780273 |
| 165.23 | 0.45646246749 |
| 165.29 | 0.43721492227 |
| 165.35 | 0.41595180147 |
| 165.41 | 0.39282140805 |
| 165.47 | 0.36769465179 |
| 165.53 | 0.34102308908 |
| 165.59 | 0.31261087171 |
| 165.65 | 0.28281786505 |
| 165.71 | 0.25186236341 |
| 165.77 | 0.21944414476 |
| 165.83 | 0.18609515407 |
| 165.89 | 0.15179027128 |
| 165.95 | 0.1168190559 |
| 166.01 | 0.080962667945 |
| 166.07 | 0.044822771489 |
| 166.13 | 0.0083294048977 |
| 166.19 | -0.02833142558 |
| 166.25 | -0.064855927879 |
| 166.31 | -0.10119688249 |
| 166.37 | -0.13724356918 |
| 166.43 | -0.1725548097 |
| 166.49 | -0.20744210702 |
| 166.55 | -0.24088522425 |
| 166.61 | -0.27355301049 |
| 166.67 | -0.30465555947 |
| 166.73 | -0.3343424449 |
| 166.79 | -0.36242632808 |
| 166.85 | -0.3887527671 |
| 166.91 | -0.41325781946 |
| 166.97 | -0.43556719426 |
| 167.03 | -0.45582318124 |
| 167.09 | -0.47355334114 |
| 167.15 | -0.48889926436 |
| 167.21 | -0.5020814818 |
| 167.27 | -0.51266230076 |
| 167.33 | -0.52062734834 |
| 167.39 | -0.52596297902 |
| 167.45 | -0.5290011805 |
| 167.51 | -0.52922290876 |
| 167.57 | -0.52712953597 |
| 167.63 | -0.52220566712 |
| 167.69 | -0.5149574615 |
| 167.75 | -0.50540133031 |
| 167.81 | -0.49322521213 |
| 167.87 | -0.47892826483 |
| 167.93 | -0.46240657424 |
| 167.99 | -0.44379341391 |
| 168.05 | -0.42317992456 |
| 168.11 | -0.40051577285 |
| 168.17 | -0.37612057991 |
| 168.23 | -0.34989032721 |
| 168.29 | -0.32204939257 |
| 168.35 | -0.29260458502 |
| 168.41 | -0.26195129798 |
| 168.47 | -0.23012801187 |
| 168.53 | -0.1971720253 |
| 168.59 | -0.16314467973 |
| 168.65 | -0.12827323544 |
| 168.71 | -0.092782370934 |
| 168.77 | -0.056714162847 |
| 168.83 | -0.020275746681 |
| 168.89 | 0.016330365988 |
| 168.95 | 0.053108759844 |
| 169.01 | 0.089383436775 |
| 169.07 | 0.12555532054 |
| 169.13 | 0.16123921842 |
| 169.19 | 0.19604857151 |
| 169.25 | 0.23011454791 |
| 169.31 | 0.26295503147 |
| 169.37 | 0.29459301091 |
| 169.43 | 0.32496326443 |
| 169.49 | 0.35363494914 |
| 169.55 | 0.38037369849 |
| 169.61 | 0.40549025999 |
| 169.67 | 0.42856213487 |
| 169.73 | 0.44933898172 |
| 169.79 | 0.46801270348 |
| 169.85 | 0.48413555891 |
| 169.91 | 0.49808040193 |
| 169.97 | 0.50944717727 |
| 170.03 | 0.51826055308 |
| 170.09 | 0.52455796166 |
| 170.15 | 0.52822743381 |
| 170.21 | 0.52939605627 |
| 170.27 | 0.52798181894 |
| 170.33 | 0.52400841921 |
| 170.39 | 0.51769571363 |
| 170.45 | 0.50854999018 |
| 170.51 | 0.49738797805 |
| 170.57 | 0.48368619818 |
| 170.63 | 0.4679411117 |
| 170.69 | 0.4501659046 |
| 170.75 | 0.43006821533 |
| 170.81 | 0.40811240198 |
| 170.87 | 0.38420734455 |
| 170.93 | 0.35854847418 |
| 170.99 | 0.3312004779 |
| 171.05 | 0.30237613766 |
| 171.11 | 0.27235032676 |
| 171.17 | 0.24071523211 |
| 171.23 | 0.2079088576 |
| 171.29 | 0.17418382169 |
| 171.35 | 0.13960711144 |
| 171.41 | 0.10437420729 |
| 171.47 | 0.06854496337 |
| 171.53 | 0.031921575422 |
| 171.59 | -0.0043556146684 |
| 171.65 | -0.041021201373 |
| 171.71 | -0.077509417323 |
| 171.77 | -0.11397160928 |
| 171.83 | -0.14962945024 |
| 171.89 | -0.18495047207 |
| 171.95 | -0.21931666352 |
| 172.01 | -0.25233131424 |
| 172.07 | -0.2844079848 |
| 172.13 | -0.31523594499 |
| 172.19 | -0.34441446002 |
| 172.25 | -0.37196338173 |
| 172.31 | -0.39753381821 |
| 172.37 | -0.42133029057 |
| 172.43 | -0.44290981954 |
| 172.49 | -0.46211458626 |
| 172.55 | -0.47914770661 |
| 172.61 | -0.49382544473 |
| 172.67 | -0.50597298581 |
| 172.73 | -0.5156956659 |
| 172.79 | -0.52271851279 |
| 172.85 | -0.52729355582 |
| 172.91 | -0.52925852079 |
| 172.97 | -0.52869716904 |
| 173.03 | -0.52558433247 |
| 173.09 | -0.51992371173 |
| 173.15 | -0.51182999185 |
| 173.21 | -0.50140085227 |
| 173.27 | -0.48857999271 |
| 173.33 | -0.47341375142 |
| 173.39 | -0.45612873233 |
| 173.45 | -0.43683085479 |
| 173.51 | -0.41546042598 |
| 173.57 | -0.39241696505 |
| 173.63 | -0.36711583909 |
| 173.69 | -0.34036678893 |
| 173.75 | -0.31194347251 |
| 173.81 | -0.28212080342 |
| 173.87 | -0.25114862316 |
| 173.93 | -0.21868136277 |
| 173.99 | -0.18534313448 |
| 174.05 | -0.15098241818 |
| 174.11 | -0.11605664656 |
| 174.17 | -0.080030678637 |
| 174.23 | -0.044101555301 |
| 174.29 | -0.0075648908976 |
| 174.35 | 0.029059705239 |
| 174.41 | 0.065702983341 |
| 174.47 | 0.10210762894 |
| 174.53 | 0.13797076211 |
| 174.59 | 0.17328917498 |
| 174.65 | 0.20821815346 |
| 174.71 | 0.24162814727 |
| 174.77 | 0.27418860356 |
| 174.83 | 0.30529703987 |
| 174.89 | 0.33494258661 |
| 174.95 | 0.36302542635 |
| 175.01 | 0.38934594309 |
| 175.07 | 0.41363868722 |
| 175.13 | 0.43608067736 |
| 175.19 | 0.4561715879 |
| 175.25 | 0.47384655493 |
| 175.31 | 0.48928720586 |
| 175.37 | 0.50229012126 |
| 175.43 | 0.51286606905 |
| 175.49 | 0.52075477479 |
| 175.55 | 0.52606189783 |
| 175.61 | 0.52902552611 |
| 175.67 | 0.52922245131 |
| 175.73 | 0.52702920257 |
| 175.79 | 0.5220246386 |
| 175.85 | 0.51473256293 |
| 175.91 | 0.50513593923 |
| 175.97 | 0.49294389877 |
| 176.03 | 0.47864010305 |
| 176.09 | 0.46202146208 |
| 176.15 | 0.44334544753 |
| 176.21 | 0.42271847938 |
| 176.27 | 0.40006156278 |
| 176.33 | 0.37558690162 |
| 176.39 | 0.34932997339 |
| 176.45 | 0.32144819438 |
| 176.51 | 0.29204890202 |
| 176.57 | 0.26135459514 |
| 176.63 | 0.229438237 |
| 176.69 | 0.19643429281 |
| 176.75 | 0.16236284146 |
| 176.81 | 0.12751411085 |
| 176.87 | 0.091979334955 |
| 176.93 | 0.05585623316 |
| 176.99 | 0.01949097867 |
| 177.05 | -0.017116891969 |
| 177.11 | -0.053772831081 |
| 177.17 | -0.090200481059 |
| 177.23 | -0.12637168517 |
| 177.29 | -0.16203118521 |
| 177.35 | -0.19694195874 |
| 177.41 | -0.23078780814 |
| 177.47 | -0.26363513943 |
| 177.53 | -0.2952395115 |
| 177.59 | -0.3254911375 |
| 177.65 | -0.35422606582 |
| 177.71 | -0.38091638978 |
| 177.77 | -0.4060490302 |
| 177.83 | -0.42904472703 |
| 177.89 | -0.44985374672 |
| 177.95 | -0.4683709323 |
| 178.01 | -0.48451100287 |
| 178.07 | -0.49832472762 |
| 178.13 | -0.50968325135 |
| 178.19 | -0.51844501693 |
| 178.25 | -0.52466379657 |
| 178.31 | -0.52829970248 |
| 178.37 | -0.52944882331 |
| 178.43 | -0.52795791028 |
| 178.49 | -0.52392088454 |
| 178.55 | -0.51742487441 |
| 178.61 | -0.50836798535 |
| 178.67 | -0.49714011956 |
| 178.73 | -0.4833523232 |
| 178.79 | -0.46759899861 |
| 178.85 | -0.44966539367 |
| 178.91 | -0.4295589373 |
| 178.97 | -0.40755995218 |
| 179.03 | -0.38366893947 |
| 179.09 | -0.35796290213 |
| 179.15 | -0.33066261561 |
| 179.21 | -0.30171981626 |
| 179.27 | -0.2716714575 |
| 179.33 | -0.24001734255 |
| 179.39 | -0.20724845072 |
| 179.45 | -0.17334317175 |
| 179.51 | -0.1387688877 |
| 179.57 | -0.10359577397 |
| 179.63 | -0.067741089181 |
| 179.69 | -0.031203098099 |
| 179.75 | 0.0052396494691 |
| 179.81 | 0.041770360144 |
| 179.87 | 0.078240593933 |
| 179.93 | 0.1146514204 |
| 179.99 | 0.15041703334 |
| 180.05 | 0.18565116922 |
| 180.11 | 0.22004720189 |
| 180.17 | 0.25298740215 |
| 180.23 | 0.28506016438 |
| 180.29 | 0.31582884304 |
| 180.35 | 0.34503405195 |
| 180.41 | 0.37251342943 |
| 180.47 | 0.39806068835 |
| 180.53 | 0.42181215072 |
| 180.59 | 0.44339828617 |
| 180.65 | 0.46248020182 |
| 180.71 | 0.47950019006 |
| 180.77 | 0.49409611323 |
| 180.83 | 0.50620240165 |
| 180.89 | 0.51584392765 |
| 180.95 | 0.52285262994 |
| 181.01 | 0.52736886938 |
| 181.07 | 0.52931567477 |
| 181.13 | 0.52861897133 |
| 181.19 | 0.52543492847 |
| 181.25 | 0.51973329623 |
| 181.31 | 0.51157968192 |
| 181.37 | 0.50117887356 |
| 181.43 | 0.48821342562 |
| 181.49 | 0.4731555769 |
| 181.55 | 0.45575858898 |
| 181.61 | 0.43639189663 |
| 181.67 | 0.41497682124 |
| 181.73 | 0.39179889564 |
| 181.79 | 0.36653712384 |
| 181.85 | 0.33983235701 |
| 181.91 | 0.31128050922 |
| 181.97 | 0.28153998318 |
| 182.03 | 0.25051363708 |
| 182.09 | 0.21810853991 |
| 182.15 | 0.18474436884 |
| 182.21 | 0.15026660648 |
| 182.27 | 0.11533253258 |
| 182.33 | 0.079331545729 |
| 182.39 | 0.043207753319 |
| 182.45 | 0.0066563378614 |
| 182.51 | -0.029919826933 |
| 182.57 | -0.066456823717 |
| 182.63 | -0.10288266962 |
| 182.69 | -0.13883457898 |
| 182.75 | -0.17402599603 |
| 182.81 | -0.20886976762 |
| 182.87 | -0.24236975117 |
| 182.93 | -0.27474570017 |
| 182.99 | -0.30589356957 |
| 183.05 | -0.33555980784 |
| 183.11 | -0.36359116176 |
| 183.17 | -0.38996901863 |
| 183.23 | -0.41421656616 |
| 183.29 | -0.43660805778 |
| 183.35 | -0.45658225155 |
| 183.41 | -0.47417927648 |
| 183.47 | -0.48965624642 |
| 183.53 | -0.50252272214 |
| 183.59 | -0.51305830821 |
| 183.65 | -0.52090661156 |
| 183.71 | -0.52618459789 |
| 183.77 | -0.52901860254 |
| 183.83 | -0.52917441057 |
| 183.89 | -0.52689716699 |
| 183.95 | -0.52187102715 |
| 184.01 | -0.51462378484 |
| 184.07 | -0.5049182103 |
| 184.13 | -0.49259986431 |
| 184.19 | -0.47828058383 |
| 184.25 | -0.46162607024 |
| 184.31 | -0.44294487171 |
| 184.37 | -0.42220336168 |
| 184.43 | -0.39945984182 |
| 184.49 | -0.3750505001 |
| 184.55 | -0.34867945835 |
| 184.61 | -0.32080523876 |
| 184.67 | -0.29144942396 |
| 184.73 | -0.26077999089 |
| 184.79 | -0.22867531735 |
| 184.85 | -0.19574655313 |
| 184.91 | -0.1615638333 |
| 184.97 | -0.126661561 |
| 185.03 | -0.091206666151 |
| 185.09 | -0.055179434411 |
| 185.15 | -0.018727644246 |
| 185.21 | 0.017917520012 |
| 185.27 | 0.054547892411 |
| 185.33 | 0.091067009031 |
| 185.39 | 0.12699891646 |
| 185.45 | 0.16261296655 |
| 185.51 | 0.19761229622 |
| 185.57 | 0.23151184708 |
| 185.63 | 0.26441985147 |
| 185.69 | 0.29586286579 |
| 185.75 | 0.32614927485 |
| 185.81 | 0.35481066821 |
| 185.87 | 0.38144557196 |
| 185.93 | 0.40659862493 |
| 185.99 | 0.42951816925 |
| 186.05 | 0.45028285753 |
| 186.11 | 0.46867465999 |
| 186.17 | 0.48487125925 |
| 186.23 | 0.49858154457 |
| 186.29 | 0.50991487795 |
| 186.35 | 0.5185620776 |
| 186.41 | 0.52473761042 |
| 186.47 | 0.52835264482 |
| 186.53 | 0.52949270995 |
| 186.59 | 0.52788035495 |
| 186.65 | 0.5238492519 |
| 186.71 | 0.51723769201 |
| 186.77 | 0.50824325057 |
| 186.83 | 0.49687128734 |
| 186.89 | 0.48321960678 |
| 186.95 | 0.46730487456 |
| 187.01 | 0.4492323439 |
| 187.07 | 0.429241994 |
| 187.13 | 0.40707608459 |
| 187.19 | 0.38316137182 |
| 187.25 | 0.35741243986 |
| 187.31 | 0.33007440393 |
| 187.37 | 0.30114148619 |
| 187.43 | 0.27090241649 |
| 187.49 | 0.23933289768 |
| 187.55 | 0.20668024022 |
| 187.61 | 0.17272677647 |
| 187.67 | 0.13808245771 |
| 187.73 | 0.10281436595 |
| 187.79 | 0.066929784898 |
| 187.85 | 0.030586772576 |
| 187.91 | -0.0059936296981 |
| 187.97 | -0.042500782571 |
| 188.03 | -0.079029008853 |
| 188.09 | -0.11538033754 |
| 188.15 | -0.15108940454 |
| 188.21 | -0.18634798833 |
| 188.27 | -0.220584912 |
| 188.33 | -0.25368124018 |
| 188.39 | -0.28571947927 |
| 188.45 | -0.31643704728 |
| 188.51 | -0.34551807141 |
| 188.57 | -0.373072122 |
| 188.63 | -0.39857049765 |
| 188.69 | -0.42217997939 |
| 188.75 | -0.44369105817 |
| 188.81 | -0.4628729545 |
| 188.87 | -0.47987481965 |
| 188.93 | -0.49436883259 |
| 188.99 | -0.50640100832 |
| 189.05 | -0.51609260423 |
| 189.11 | -0.52299232534 |
| 189.17 | -0.52741795766 |
| 189.23 | -0.52934573835 |
| 189.29 | -0.52858552171 |
| 189.35 | -0.52529981585 |
| 189.41 | -0.51958573078 |
| 189.47 | -0.51140829935 |
| 189.53 | -0.50093387092 |
| 189.59 | -0.48787096363 |
| 189.65 | -0.47279481165 |
| 189.71 | -0.45546188124 |
| 189.77 | -0.43591950536 |
| 189.83 | -0.41451621901 |
| 189.89 | -0.39126918888 |
| 189.95 | -0.36603700248 |
| 190.01 | -0.33932689615 |
| 190.07 | -0.31065572904 |
| 190.13 | -0.28090144503 |
| 190.19 | -0.2497593787 |
| 190.25 | -0.21725406094 |
| 190.31 | -0.18389569679 |
| 190.37 | -0.1495239672 |
| 190.43 | -0.1144558607 |
| 190.49 | -0.078615606832 |
| 190.55 | -0.042440635837 |
| 190.61 | -0.0058907502231 |
| 190.67 | 0.030626607224 |
| 190.73 | 0.067177559305 |
| 190.79 | 0.10363070538 |
| 190.85 | 0.13935758361 |
| 190.91 | 0.17494925608 |
| 190.97 | 0.20957734618 |
| 191.03 | 0.24303787953 |
| 191.09 | 0.27556686021 |
| 191.15 | 0.30655652302 |
| 191.21 | 0.33618486919 |
| 191.27 | 0.36412368692 |
| 191.33 | 0.39045795279 |
| 191.39 | 0.41486195169 |
| 191.45 | 0.43702509807 |
| 191.51 | 0.45685605284 |
| 191.57 | 0.47453360902 |
| 191.63 | 0.48992202686 |
| 191.69 | 0.50279944013 |
| 191.75 | 0.51315317474 |
| 191.81 | 0.52107320483 |
| 191.87 | 0.52633990008 |
| 191.93 | 0.52900998801 |
| 191.99 | 0.5291125224 |
| 192.05 | 0.52681713042 |
| 192.11 | 0.52172763752 |
| 192.17 | 0.51443434138 |
| 192.23 | 0.5047241884 |
| 192.29 | 0.49235850172 |
| 192.35 | 0.47794032555 |
| 192.41 | 0.4613245848 |
| 192.47 | 0.44251992127 |
| 192.53 | 0.42185257429 |
| 192.59 | 0.39900617173 |
| 192.65 | 0.37444688648 |
| 192.71 | 0.34808733908 |
| 192.77 | 0.32009550261 |
| 192.83 | 0.29080808839 |
| 192.89 | 0.26014068652 |
| 192.95 | 0.22819108397 |
| 193.01 | 0.19495837369 |
| 193.07 | 0.16085280714 |
| 193.13 | 0.12593925497 |
| 193.19 | 0.090451737637 |
| 193.25 | 0.054401395714 |
| 193.31 | 0.017958954141 |
| 193.37 | -0.018652956798 |
| 193.43 | -0.055314643171 |
| 193.49 | -0.091744782366 |
| 193.55 | -0.12786203257 |
| 193.61 | -0.16346192049 |
| 193.67 | -0.19828516782 |
| 193.73 | -0.23226417298 |
| 193.79 | -0.26497514489 |
| 193.85 | -0.29654010203 |
| 193.91 | -0.32676952546 |
| 193.97 | -0.35545624857 |
| 194.03 | -0.38212244523 |
| 194.09 | -0.40713500724 |
| 194.15 | -0.42994182508 |
| 194.21 | -0.45059602447 |
| 194.27 | -0.46902785864 |
| 194.33 | -0.48518081707 |
| 194.39 | -0.49889187928 |
| 194.45 | -0.51012050781 |
| 194.51 | -0.51873865911 |
| 194.57 | -0.52484696192 |
| 194.63 | -0.52846821952 |
| 194.69 | -0.52947624194 |
| 194.75 | -0.52787717747 |
| 194.81 | -0.52374581028 |
| 194.87 | -0.51707118422 |
| 194.93 | -0.50806264523 |
| 194.99 | -0.49664180609 |
| 195.05 | -0.48288460815 |
| 195.11 | -0.46696521443 |
| 195.17 | -0.44890175118 |
| 195.23 | -0.42883767602 |
| 195.29 | -0.40661028133 |
| 195.35 | -0.38266267537 |
| 195.41 | -0.3568420736 |
| 195.47 | -0.32948879042 |
| 195.53 | -0.30057488552 |
| 195.59 | -0.27031487902 |
| 195.65 | -0.23861435112 |
| 195.71 | -0.20598862778 |
| 195.77 | -0.17205533996 |
| 195.83 | -0.13739128453 |
| 195.89 | -0.10202775385 |
| 195.95 | -0.06614729855 |
| 196.01 | -0.029727440121 |
| 196.07 | 0.0066497500681 |
| 196.13 | 0.043253961501 |
| 196.19 | 0.079795751979 |
| 196.25 | 0.1160045698 |
| 196.31 | 0.15180232066 |
| 196.37 | 0.18693685965 |
| 196.43 | 0.22127988634 |
| 196.49 | 0.25432973239 |
| 196.55 | 0.28636084041 |
| 196.61 | 0.31705732111 |
| 196.67 | 0.34616927994 |
| 196.73 | 0.37359256462 |
| 196.79 | 0.39905647837 |
| 196.85 | 0.4226525154 |
| 196.91 | 0.44414542669 |
| 196.97 | 0.46325178987 |
| 197.03 | 0.48025133216 |
| 197.09 | 0.49465228707 |
| 197.15 | 0.50663845983 |
| 197.21 | 0.51631180435 |
| 197.27 | 0.52314784724 |
| 197.33 | 0.5274533578 |
| 197.39 | 0.52936777644 |
| 197.45 | 0.52852930705 |
| 197.51 | 0.52521255637 |
| 197.57 | 0.51942997982 |
| 197.63 | 0.51132856278 |
| 197.69 | 0.50071241265 |
| 197.75 | 0.48755331328 |
| 197.81 | 0.4725210456 |
| 197.87 | 0.45508545538 |
| 197.93 | 0.43563021589 |
| 197.99 | 0.4140585484 |
| 198.05 | 0.39072089768 |
| 198.11 | 0.36551912661 |
| 198.17 | 0.33873767744 |
| 198.23 | 0.31011285915 |
| 198.29 | 0.28026508864 |
| 198.35 | 0.24909475011 |
| 198.41 | 0.21656198726 |
| 198.47 | 0.18319730204 |
| 198.53 | 0.14884150735 |
| 198.59 | 0.11370791593 |
| 198.65 | 0.077924531642 |
| 198.71 | 0.041814319982 |
| 198.77 | 0.0051501054349 |
| 198.83 | -0.031372495531 |
| 198.89 | -0.067924764195 |
| 198.95 | -0.10436672653 |
| 199.01 | -0.1401123911 |
| 199.07 | -0.17565091427 |
| 199.13 | -0.21024640356 |
| 199.19 | -0.24366181973 |
| 199.25 | -0.27609688376 |
| 199.31 | -0.30718586455 |
| 199.37 | -0.33679028468 |
| 199.43 | -0.36467865653 |
| 199.49 | -0.39106769107 |
| 199.55 | -0.41535476806 |
| 199.61 | -0.43741338043 |
| 199.67 | -0.45726642714 |
| 199.73 | -0.47489724538 |
| 199.79 | -0.49017665229 |
| 199.85 | -0.50305442118 |
| 199.91 | -0.51330619501 |
| 199.97 | -0.52120831838 |
| 200 | -0.52407278585 |
| Quantity | Reference (Qu et al. 2013) | Simulation, finest grid | Signed difference |
|---|---|---|---|
| Strouhal number | 0.1841 | 0.183855 | −0.13 % |
| Mean drag coefficient (non-monotone in the grid) | 1.305 | 1.32266 | +1.35 % |
| rms lift coefficient (non-monotone in the grid) | 0.3546 | 0.374123 | +5.5 % |
| rms drag coefficient (non-monotone in the grid) | 0.0173 | 0.0189802 | +9.7 % |
The lift history over the last 10 periods is a clean, single-frequency oscillation, so the shedding is saturated and periodic. The frequency agrees with the reference to well under a percent on every grid; the force levels agree less well.
Mean drag is +1.35 % above the reference, rms lift +5.5 % and rms drag +9.7 %. None of the three converges monotonically on the four grids, so these differences have no numerical band and I do not claim them.
8Numerical accuracy
Strouhal number, four grids, least squares (Eça and Hoekstra, the shared gci.py): observed order 0.866, extrapolated value 0.1828, uncertainty 0.97 % of the finest-grid value. That band rests on the coarsest grid: on the three finest grids alone the tool refuses a GCI (e32/e21 = 0.1201, no positive-order solution).
So the honest statement is that St lies within 0.84 % of the reference on all four grids, not that it is verified to 0.97 %. A fifth grid of 89,496 cells is owed.
Mean drag: the least-squares fit is anomalous (p <= 0 in both delta_RE fits) and its band, 8.8 %, is a charge for the scatter, not an error estimate. rms lift: BAD fit, band 12.2 %; rms drag 17.9 % (lane audit).
Output of the shared GCI tool, unedited
Strouhal number, four grids, least squares
LSR      Eca & Hoekstra 2014 least-squares, ng=4  (h sorted finest->coarsest: 1.0000, 1.4088, 2.0000, 2.8284)
         f: 0.183855, 0.184513, 0.184592, 0.185641
         delta_RE unweighted p =   1.4844   sigma = 0.0003278
         delta_RE eq16       p =   0.8662   sigma = 0.0003255
         observed order p = 0.866   (formal 2.0)   verdict: apparently monotonic
         chosen fit: p-free (eq16)   phi0 = 0.182800   alpha = 0.00111654
         sigma = 0.0003255   Delta_phi = 0.0005953   F_sigma = 0.547  (want < 1)
         U_phi(finest) = 0.00178237  (0.969 % of f_fine; eq (20); Fs=1.25; eps=0.001117, sigma=0.0003255, |f-fit|=6.119e-05)
Strouhal number, three finest grids
GCI REFUSED: e32/e21 = 0.1201 <= the p->0+ limit 1.0223 (= ln(r32)/ln(r21)): NO POSITIVE-ORDER SOLUTION EXISTS. The errors are not shrinking fast enough under refinement to be consistent with any convergent order -- the true apparent order is NEGATIVE (the solution DIVERGES with refinement). No GCI is defensible. Report the spread.
Mean drag, four grids, least squares
LSR      Eca & Hoekstra 2014 least-squares, ng=4  (h sorted finest->coarsest: 1.0000, 1.4088, 2.0000, 2.8284)
         f: 1.322660, 1.329970, 1.334630, 1.323900
         delta_RE unweighted p =  -4.0000   sigma = 0.008039
         delta_RE eq16       p =  -4.0000   sigma = 0.006436
         observed order p = n/a   (formal 2.0)   verdict: anomalous (p <= 0 in both delta_RE fits)
         chosen fit: 1&2 combined (unweighted)   phi0 = 1.284030   alpha = 0.0516712   alpha2 = -0.0132747
         sigma = 0.000668   Delta_phi = 0.00399   F_sigma = 0.167  (want < 1)
         U_phi(finest) = 0.116091  (8.777 % of f_fine; eq (20); Fs=3.00; eps=0.0384, sigma=0.000668, |f-fit|=0.0002333)
         WARNING: delta_RE (unweighted) p=-4.000 sits at the edge of the search window (-4.0, 8.0) -- not a physical order.
         WARNING: delta_RE (eq16) p=-4.000 sits at the edge of the search window (-4.0, 8.0) -- not a physical order.
         WARNING: Fs escalated to 3 (no p > 0) -- Sec. 3 p.108.
         WARNING: delta_RE NOT used: p impossible to establish (both delta_RE fits p <= 0): 6 fixed-exponent fits (App. A bullet 3). Chosen '1&2 combined' (unweighted) on smallest sigma.
rms lift, four grids, least squares
LSR      Eca & Hoekstra 2014 least-squares, ng=4  (h sorted finest->coarsest: 1.0000, 1.4088, 2.0000, 2.8284)
         f: 0.374123, 0.378915, 0.384773, 0.363521
         delta_RE unweighted p =   8.0000   sigma = 0.008266
         delta_RE eq16       p =   8.0000   sigma = 0.008371
         observed order p = 8.000   (formal 2.0)   verdict: apparently monotonic (p > 0) with non-monotonic scatter
         chosen fit: p=2 (eq16)   phi0 = 0.379292   alpha = -0.00114297
         sigma = 0.008134   Delta_phi = 0.007084   F_sigma = 1.148  (want < 1)
         U_phi(finest) = 0.0458279  (12.249 % of f_fine; eq (21); Fs=3.00; eps=0.001143, sigma=0.008134, |f-fit|=0.004026)
         WARNING: delta_RE (unweighted) p=8.000 sits at the edge of the search window (-4.0, 8.0) -- not a physical order.
         WARNING: delta_RE (eq16) p=8.000 sits at the edge of the search window (-4.0, 8.0) -- not a physical order.
         WARNING: raw data are NOT monotone in h (scatter); the paper classifies by p > 0 and charges the scatter through sigma and |phi - phi_fit|.
         WARNING: sigma=0.008134 >= Delta_phi=0.007084: BAD fit (F_sigma=1.15 > 1). U from eq (21); the paper says this 'indicates clearly that the data quality is bad'.
         WARNING: Fs escalated to 3 (p=8.000 outside [0.5, 2.14), sigma >= Delta_phi) -- Sec. 3 p.108.
         WARNING: delta_RE NOT used: p=8.000 > 2: 4 fixed-exponent fits (App. A bullet 2). Chosen 'p=2' (eq16) on smallest sigma.
         WARNING: observed p=8.000 EXCEEDS the formal order 2.0 by >15% -- a warning, not a bonus.
From data/cylinder-re150/gci.json (st_lsr_4grid), data/cylinder-re150/gci.json (st_gci_3finest), data/cylinder-re150/gci.json (cd_lsr_4grid), data/cylinder-re150/gci.json (clrms_lsr_4grid), written by pipeline/build_assets.py.
9Why they differ, and what I distrust
Limits, as recorded in the ledger. Only St is defensible: -0.13 % vs Qu et al. 2013 on the finest grid and within 0.9 % on all four, but the three finest grids are not monotone (GCI refused) and the extrapolated value is 0.1828. Cd +1.4 %, CL' +5.5 %, CD' +9.7 % with BAD fits (bands 9-18 %). The Curle noise level has no numeric reference; DNS St 0.183 is second-hand. A finer grid (89k) is owed.
- The reference is another simulation, so this is a code-to-code comparison, not a validation against experiment.
- St on the three finest grids does not converge monotonically: the last refinement step (−0.36 %) is several times the one before (−0.04 %).
- Mean drag, rms lift and rms drag scatter with refinement and the coarsest grid is an outlier; their least-squares bands describe bad fits.
- rms drag is the quantity most sensitive to the time step in the reference paper, and my time steps differ from its 386 × 322 cells, time step 0.01.
- The case also computes far-field noise with Curle's analogy. There is no numeric reference for the noise level, so I do not show it.
- The flow is 2-D and laminar by design.
10References
- Qu, L., Norberg, C., Davidson, L. (2013), Quantitative numerical analysis of flow past a circular cylinder at Reynolds number between 50 and 200, J. Fluids Struct. 39, 347-370 (author's version, Chalmers Publication Library). Table 3.
- Inoue, O. & Hatakeyama, N. (2002), Sound generation by a two-dimensional circular cylinder in a uniform flow, J. Fluid Mech. 471, 285-314. Not obtained; its St is known here only second-hand and is not used.
- Eça and Hoekstra (2014): the least-squares numerical-uncertainty procedure, as implemented in the project's gci.py.
Source files
D:/CFD/aeroacoustics/cylinder-re150/g0.3536/, g0.5/, g0.7071/, g1/ (RESULT.txt, meta.txt, log.checkMesh)D:/CFD/aeroacoustics/cylinder-re150/g1/0/, constant/, system/D:/CFD/aeroacoustics/cylinder-re150/g1/postProcessing/forceCoeffs1/0/coefficient.datD:/CFD/aeroacoustics/cylinder-re150/make_case.pyD:/CFD/data/aeroacoustics/cylinder-re150/SPEC.md (section 8: Qu et al. Table 3)investigation/lane-D-propeller-cylinder.md (evidence audit, recomputed differences)site/public/data/cylinder-re150/ (force_coefficients.csv, README.txt, chart JSON and gci.json from pipeline/case_data/cylinder-re150.py)
Last updated 2026-11-14. One-page summary (prints to one A4 page), also as a PDF. Every number on this page is checked against its source file by pipeline/check_numbers.py.