Impinging jet: a transition model does not fix the stagnation region
I checked the inflow against hot-wire data before trusting any heat-transfer number, then tested whether a transition model recovers the secondary Nusselt peak that fully turbulent RANS misses. It did not, so I kept the simpler model.
- Stagnation Nu/Re^0.7, simulation
- 0.1384
- k-omega SST
- Stagnation Nu/Re^0.7, experiment
- 0.1223
- Baughn et al. 1992
- Signed difference
- +13.2 %
- simulation minus experiment
- Numerical uncertainty
- none: single grid
2Geometry, mesh, results
Axisymmetric section: a long pipe ending above a heated plate; walls, inlet and open boundaries drawn as lines.


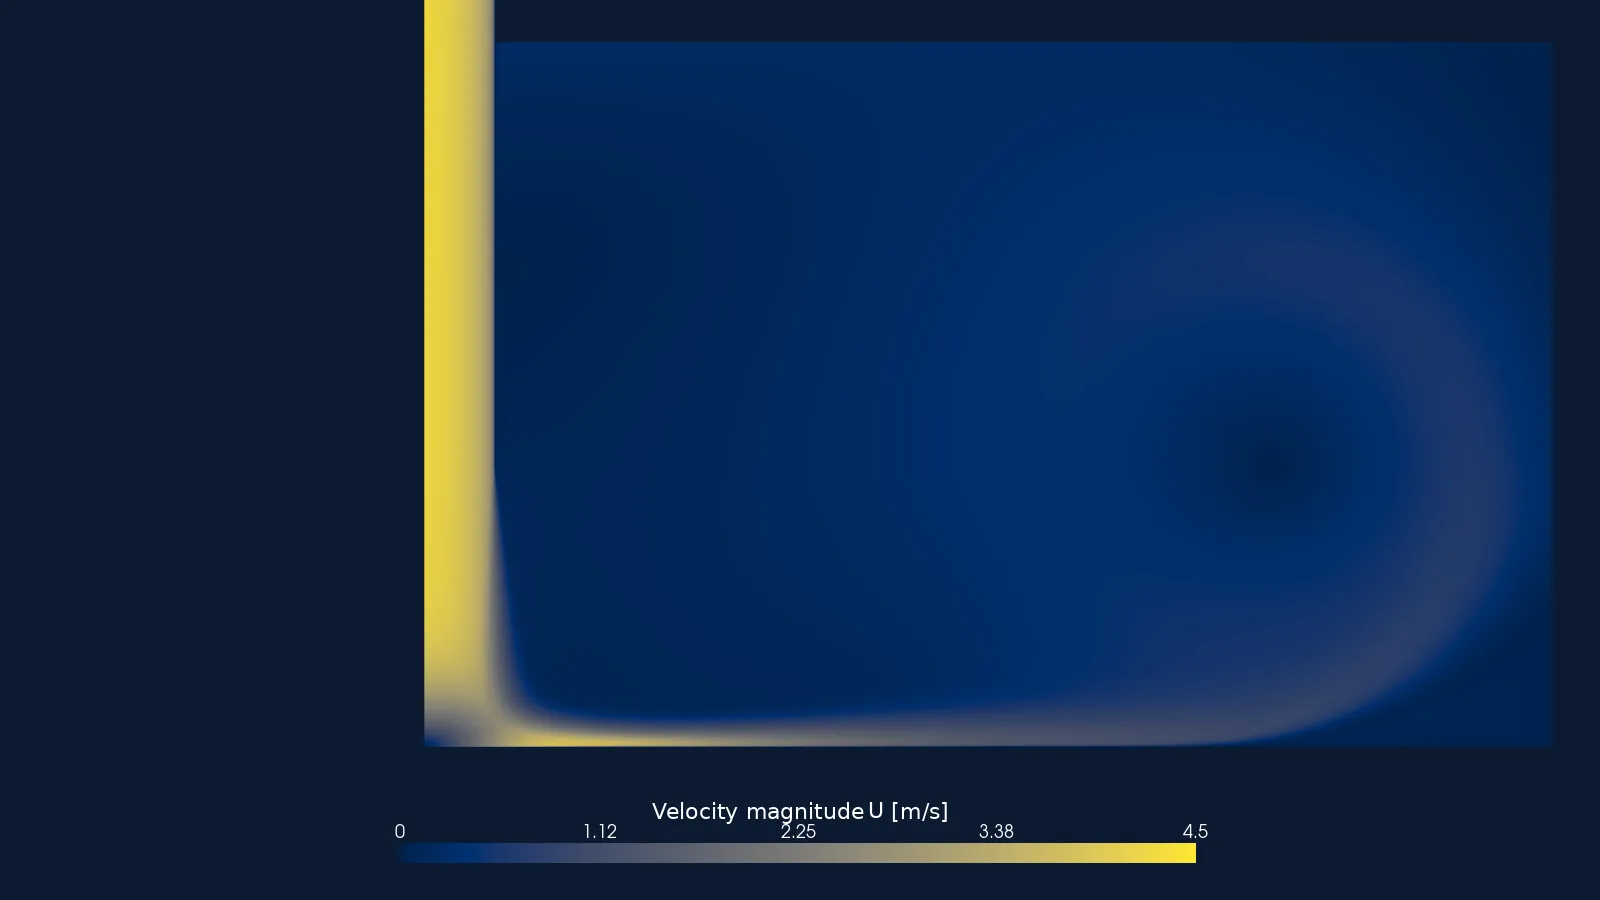
No poster exported for this step.
Drag to pan, wheel or pinch to zoom, click to read a value. Keys: arrows pan, + and − zoom, Enter reads the value at the centre.
3Case parameters
| Reynolds number (bulk velocity, nozzle diameter) | 23,000 |
|---|---|
| Nozzle-to-plate distance H/D | 2 |
| Nozzle diameter D | 0.1016 m |
| Bulk velocity | 3.48857 m/s |
| Fluid | Air: density 1.18816 kg/m³, viscosity 1.831e-05 Pa s, Prandtl number 0.705 |
| Solver | OpenFOAM v2412, buoyantSimpleFoam with gravity off (forced convection) |
| Turbulence model | k-omega SST; Langtry-Menter k-omega SST-LM on the identical mesh |
| Wall treatment | Wall-resolved: plate first cell 20 µm, y+ max 0.23 |
| Cells | 110,547 |
| Run cost | Not recorded |
4Experiment
ERCOFTAC Classic Collection case 025. The heat-transfer data are Nusselt numbers along the plate from Baughn et al. (1992), given as Nu/Re^0.7 against r/D. The measured stagnation value is 0.1223, and the profile has a secondary peak of 0.0941 at r/D 1.94.
The velocity data are mean-velocity profiles from Cooper et al. (1993), measured with a single hot wire. I used them to check the inflow before looking at heat transfer.
| Stated uncertainty | Not stated in the source for the Nusselt numbers; the experimental Nu uncertainty is unknown. |
|---|---|
| Blockage and corrections | Not applicable: a free jet in still air, no tunnel blockage. |
| Licence | ERCOFTAC database, CC BY-NC-SA 4.0 |
Nusselt number along the plate (Nu/Re^0.7): experiment, SST and SST-LM
Experimental values (24 points)
| r/D | Experiment (Baughn et al. 1992) |
|---|---|
| 0 | 0.1223 |
| 0.32 | 0.1175 |
| 0.64 | 0.1095 |
| 0.78 | 0.0942 |
| 0.88 | 0.0912 |
| 0.94 | 0.0868 |
| 1.05 | 0.0806 |
| 1.26 | 0.0775 |
| 1.52 | 0.0806 |
| 1.69 | 0.0865 |
| 1.84 | 0.091 |
| 1.94 | 0.0941 |
| 2.15 | 0.0907 |
| 2.36 | 0.0866 |
| 2.51 | 0.0807 |
| 2.67 | 0.0774 |
| 2.83 | 0.0733 |
| 3.15 | 0.0654 |
| 3.47 | 0.0589 |
| 3.79 | 0.0541 |
| 4.1 | 0.0498 |
| 4.41 | 0.046 |
| 4.73 | 0.0425 |
| 5.05 | 0.0397 |
5Set-up
Axisymmetric wedge (faces at 2.5° either side of the mid-plane), with a 30D pipe upstream of the nozzle so the inflow develops before it leaves the pipe. The plate carries a fixed heat flux; because Nu is non-dimensional and the temperature rise is small, the comparison does not depend on the flux value.
SST and SST-LM were run on the identical mesh and set-up. The only differences are the turbulence model, its two extra fields and the iteration count: SST 4000 iterations, SST-LM 8000.
Inflow checked first, on the SST run: at the pipe exit the area-mean velocity over the bulk velocity is 1.001 and the centreline over the bulk is 1.22. Downstream mean-velocity profiles are within 0.03–0.07 of the bulk velocity (RMS) at most stations and 0.107 at r/D 0.5, against the Cooper et al. hot-wire data.
| Boundary | Type | Value |
|---|---|---|
| Pipe inlet | fixed velocity; fixed temperature; fixed k and omega | 3.48857 m/s, uniform; 293.15 K; k 0.0456381 m²/s², omega 54.8417 1/s |
| Plate | no-slip wall, fixed heat flux (externalWallHeatFluxTemperature) | 200 W/m² |
| Pipe wall, nozzle outer wall | no-slip wall, adiabatic | zero temperature gradient |
| Ambient top and side | total pressure; inletOutlet for temperature | 100000 Pa total pressure; 293.15 K |
| Front, back | wedge | faces at 2.5° either side of the mid-plane |
| Axis | empty (wedge axis) |
Numerics and convergence
Steady, SIMPLE-type pressure-velocity coupling (buoyantSimpleFoam). Convection: bounded linearUpwind for U, h, k and omega; upwind for the two transition fields.
Convergence was judged from the Nusselt profile, not from a fixed iteration count. SST: Nu drifting at most 0.8 % over the last 500 iterations for r/D below 3. SST-LM: at most 0.6 % over the last 1000.
Reading a result before it converges misleads: at iteration 1000 SST-LM appeared to show a clear secondary peak. It faded as the field developed.
6Mesh
| Cells | 110,547 |
|---|---|
| Cell types | 110,038 hexahedra, 509 prisms |
| Plate first cell height | 20 µm |
| y+ max on the plate | 0.23 |
| Max non-orthogonality | 0 |
| Max skewness | 0.331 |
| Max aspect ratio | 738 |
| checkMesh verdict | “Mesh OK.” |
One grid. There is no grid ladder for this case.
7Results
There is no integral force here; the quantity of interest is the Nusselt number along the plate. At stagnation, SST gives 0.1384 against a measured 0.1223 (+13.2 %).
Data table (24 rows)
| r/D | Experiment (Baughn et al. 1992) | k-omega SST | k-omega SST-LM |
|---|---|---|---|
| 0 | 0.1223 | 0.1384 | 0.1419 |
| 0.32 | 0.1175 | 0.136 | 0.1418 |
| 0.64 | 0.1095 | 0.133 | 0.1357 |
| 0.78 | 0.0942 | 0.1266 | 0.1275 |
| 0.88 | 0.0912 | 0.1207 | 0.1204 |
| 0.94 | 0.0868 | 0.1171 | 0.1162 |
| 1.05 | 0.0806 | 0.1112 | 0.109 |
| 1.26 | 0.0775 | 0.1026 | 0.0985 |
| 1.52 | 0.0806 | 0.0954 | 0.0905 |
| 1.69 | 0.0865 | 0.092 | 0.0878 |
| 1.84 | 0.091 | 0.0896 | 0.0865 |
| 1.94 | 0.0941 | 0.0881 | 0.086 |
| 2.15 | 0.0907 | 0.0848 | 0.0847 |
| 2.36 | 0.0866 | 0.0809 | 0.0821 |
| 2.51 | 0.0807 | 0.0778 | 0.0795 |
| 2.67 | 0.0774 | 0.0743 | 0.0764 |
| 2.83 | 0.0733 | 0.0708 | 0.0732 |
| 3.15 | 0.0654 | 0.0639 | 0.0669 |
| 3.47 | 0.0589 | 0.0574 | 0.0612 |
| 3.79 | 0.0541 | 0.052 | 0.0561 |
| 4.1 | 0.0498 | 0.0485 | 0.0517 |
| 4.41 | 0.046 | 0.0459 | 0.0479 |
| 4.73 | 0.0425 | 0.0427 | 0.0443 |
| 5.05 | 0.0397 | 0.038 | 0.0412 |
| Quantity | Experiment | SST | SST, signed | SST-LM | SST-LM, signed |
|---|---|---|---|---|---|
| Nu error at stagnation, r/D 0 | 0.1223 | 0.1384 | +13 % | 0.1419 | +16 % |
| Nu error near r/D 0.8 to 1.3 | – | – | +32 to +38 % | – | +27 to +35 % |
| Nu error at the secondary peak, r/D 1.94 | 0.0941 | 0.0881 | −6 % (no peak) | 0.0860 | −9 % (no peak) |
| Nu error in the wall jet, r/D 2.5 and beyond | – | – | −4.3 to +0.4 % | – | −1.5 to +4.3 % |
| Mean |error|, all stations | – | – | 12.3 % | – | 12.2 % |
Wall-jet heat transfer is right; the stagnation region and the wall-jet velocity are not. SST reproduces developed wall-jet Nu from r/D about 1.8 outward, and over-predicts at stagnation, the known anomaly of eddy-viscosity models. It also over-predicts the wall-jet velocity peak by 14–20 % at r/D 2.5–3.
The transition model bought nothing visible. Same mean error, still no secondary peak. The two means (12.3 % against 12.2 %) are not a clean tie: SST was stopped at 4000 iterations and SST-LM run to 8000, and the SST wall jet beyond r/D 3 was still moving up to 2.1 % per 500 iterations.
8Numerical accuracy
None: single grid. No grid-convergence study was run for this case, so there is no numerical uncertainty band on any number above. Iterative convergence was judged from the Nusselt profile (see set-up).
9Why they differ, and what I distrust
Limits, as recorded in the ledger. Single grid, no GCI. Plate heat flux is imposed (Nu is non-dimensional); experimental Nu uncertainty unknown. Non-precursor pipe inlet. SST ran 4000 iterations against 8000 for SST-LM and its wall jet beyond r/D 3 was still moving about 2 % per 500 iterations, so the 12.3 vs 12.2 % tie is unresolved. SST over-predicts the wall-jet velocity peak by 14-20 % at r/D 2.5-3. Neither model reproduces the secondary Nu peak; the negative result is kept. Data: ERCOFTAC C.25, CC BY-NC-SA 4.0.
- Steady RANS, and a zero-thickness pipe wall with a uniform-inlet development length rather than a precursor simulation.
- The inflow check was made on the SST run only.
10References
- ERCOFTAC Classic Collection, case 025 (round jet impinging on a flat plate), experimental data CC BY-NC-SA 4.0.
- Baughn et al. (1992): Nusselt-number data, as distributed with ERCOFTAC case 025.
- Cooper et al. (1993): single-wire hot-wire mean-velocity profiles, as distributed with ERCOFTAC case 025.
Source files
D:/CFD/impinging-jet/CASE-STUDY.mdD:/CFD/impinging-jet/sst_h2_re23k/RESULT.txtD:/CFD/impinging-jet/sstlm_h2_re23k/RESULT.txtD:/CFD/impinging-jet/sst_h2_re23k/PROFILES.txtD:/CFD/impinging-jet/sst_h2_re23k/meta.txtD:/CFD/impinging-jet/sst_h2_re23k/log.checkMeshD:/CFD/impinging-jet/sst_h2_re23k/0/
Last updated 2026-11-14. One-page summary (prints to one A4 page), also as a PDF. Every number on this page is checked against its source file by pipeline/check_numbers.py.